External tools
You can define third-party applications as external tools and run them from PyCharm.
PyCharm allows you to pass contextual information from your project to the external tool as command-line arguments (for example, the currently selected file or the project source path), view the output produced by the tool, configure to launch the tool before a run/debug configuration, and more.
There are several types of external tools that you can add to PyCharm:
Local tools are applications that run locally on your computer.
Remote tools are applications executed on a remote server over SSH.
Add a local external tool
pylint is a code analyzer tool that checks your code and detects any style, logic, and usage problems. It might be a great addition to the code validation features available with PyCharm.
Press Ctrl+Alt+S to open IDE settings and select Project | Python Interpreter.
Click
to install a new package.
In the Available packages window, search for "pylint", then choose it in the list of packages, and click Install Package.
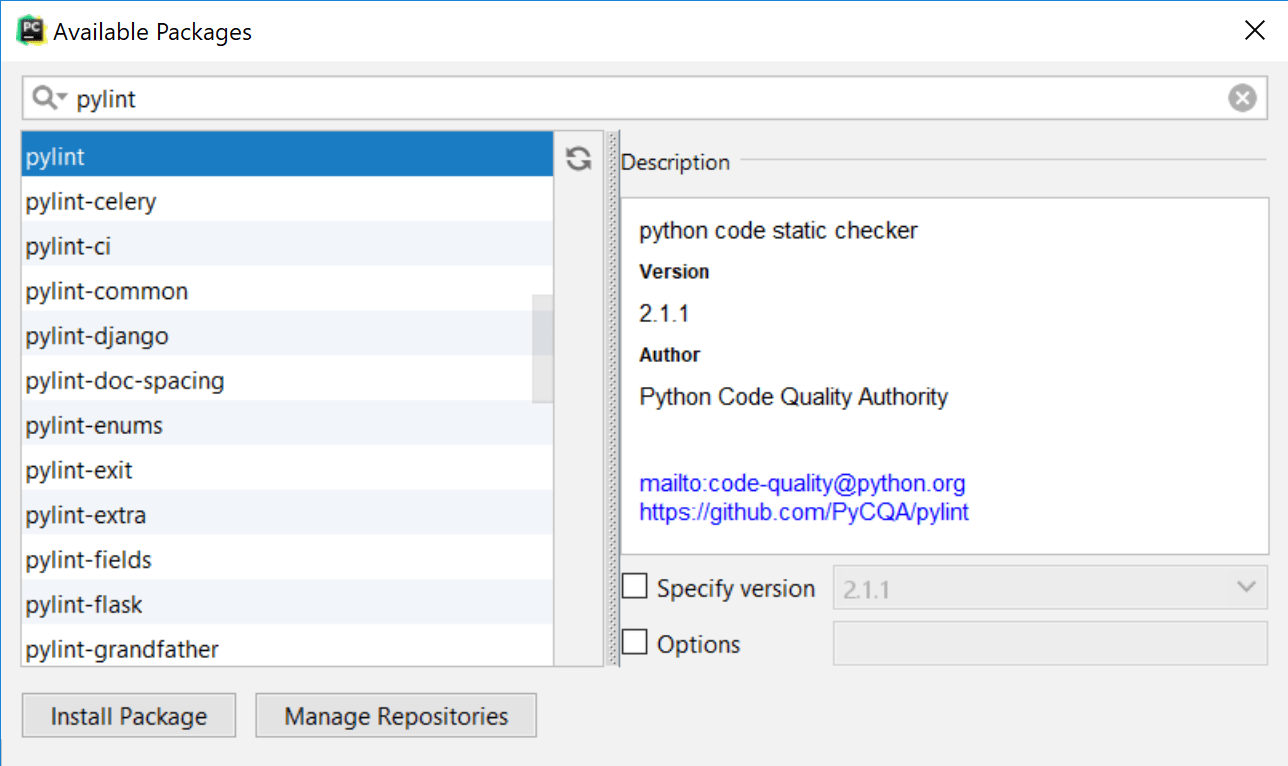
Wait until the package is installed and close the window.
Now that you have installed pylint on your system, you can configure its integration with PyCharm.
Press Ctrl+Alt+S to open IDE settings and select Tools | External Tools.
Click the
button to add a new external tool.
Add configuration options as shown below:
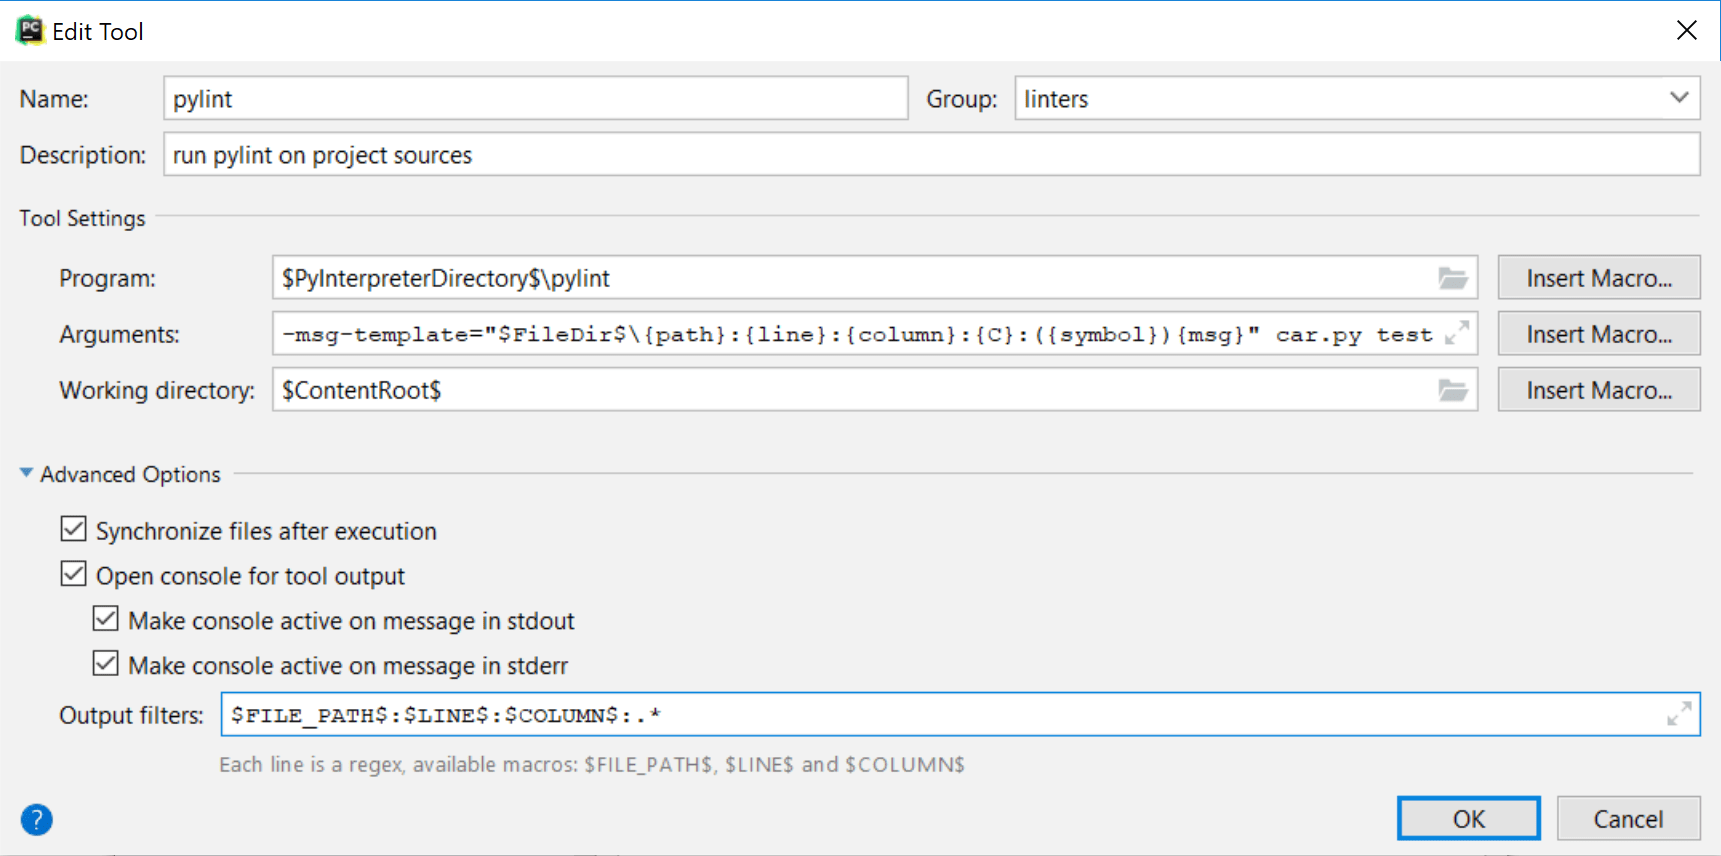
Group: The name of the external tool group to show in the menu
Name: The external tool name
Description: An optional description
Program: The path to the pylint executable (
$PyInterpreterDirectory$is a directory where the Python interpreter of the current project is placed).
Example:$PyInterpreterDirectory$\pylint$PyInterpreterDirectory$/pylintArgument: Specifies what files and folders should be checked (car.py and test in this example) and sets the output format for pylint errors.
Example:--msg-template="$FileDir$\{path}:{line}:{column}:{C}:({symbol}){msg}" car.py test--msg-template="$FileDir$/{path}:{line}:{column}:{C}:({symbol}){msg}" car.py testWorking directory: Project root directory
It is recommended to enable all options from the Advanced Options section and set up the Output filters to insert links to the files with errors into the pylint output, so you can quickly jump to an error or warning in your code.
Click OK to save the changes. Complete adding an external tool by clicking Apply and OK in the External Tools window.
Now you can access this external tool from the .

You can run pylint using this menu. However, you might also want to add it to the Run/Debug Configuration of your application.
Run the external tool
From the main menu, choose , then in the Edit Configurations dialog, click
in the Before launch section.
Select Run External tool from the Add new configuration list and specify pylint. It will be added to the list of scripts to be executed before the application launch.
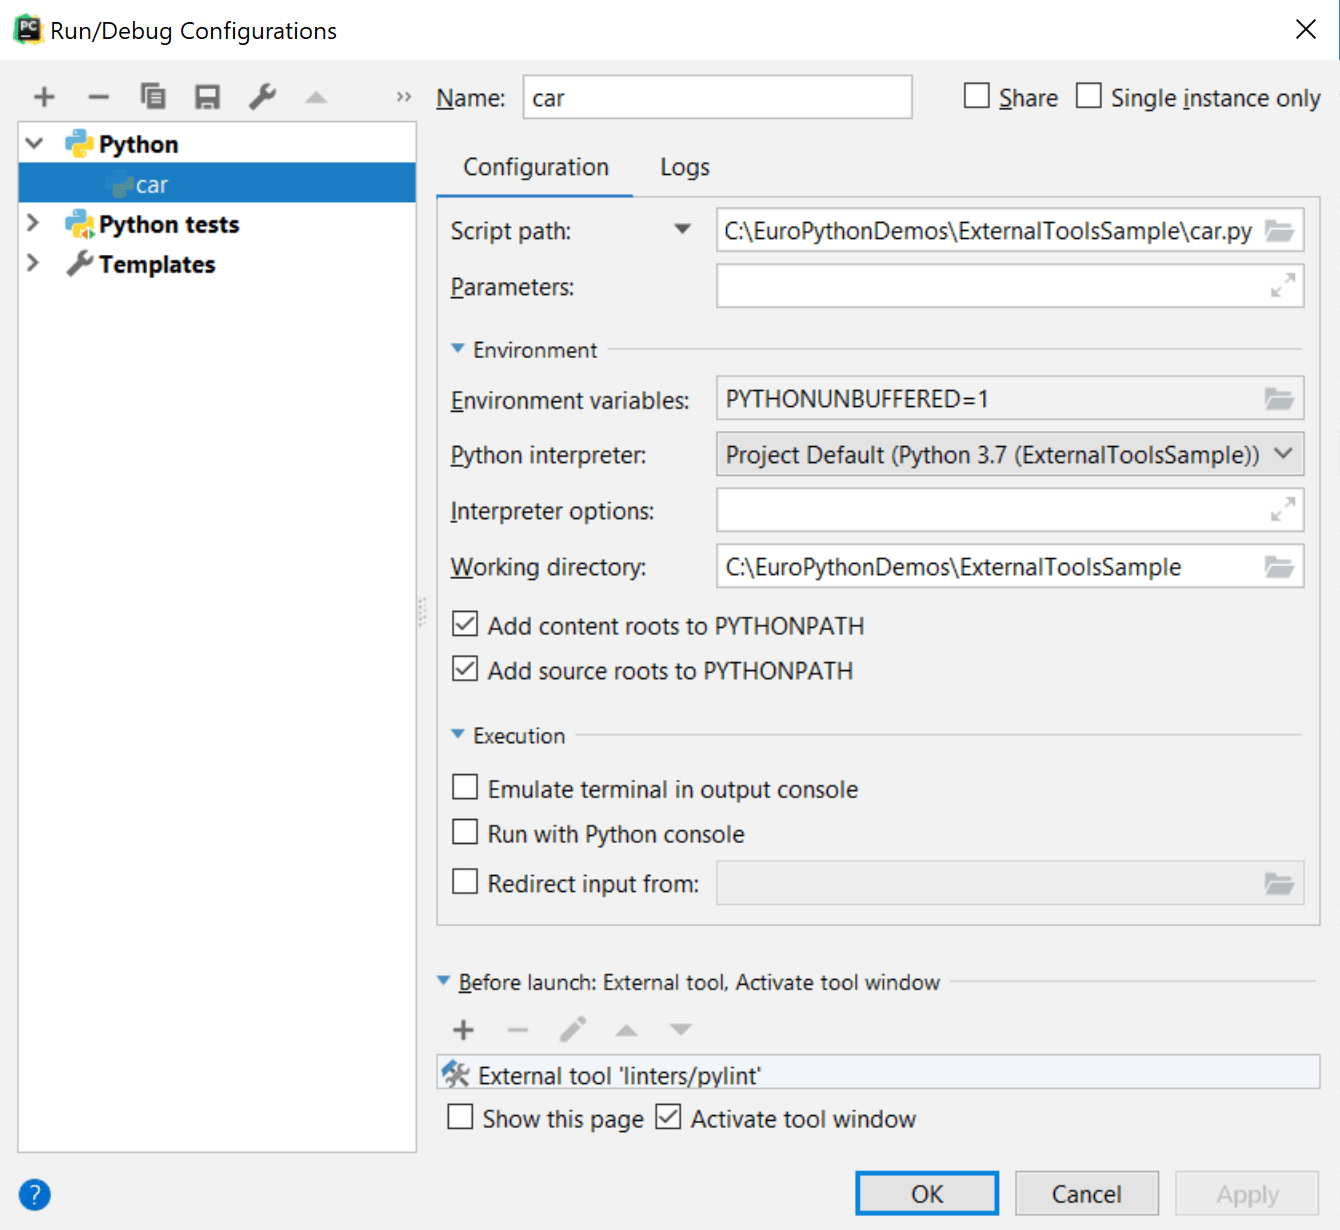
Click OK to save the changes
Run the Run/Debug configuration Shift+F10.
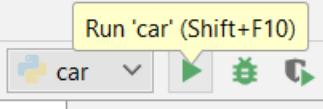
You should expect to see the pylint tab in the Tools window with the following sample output:
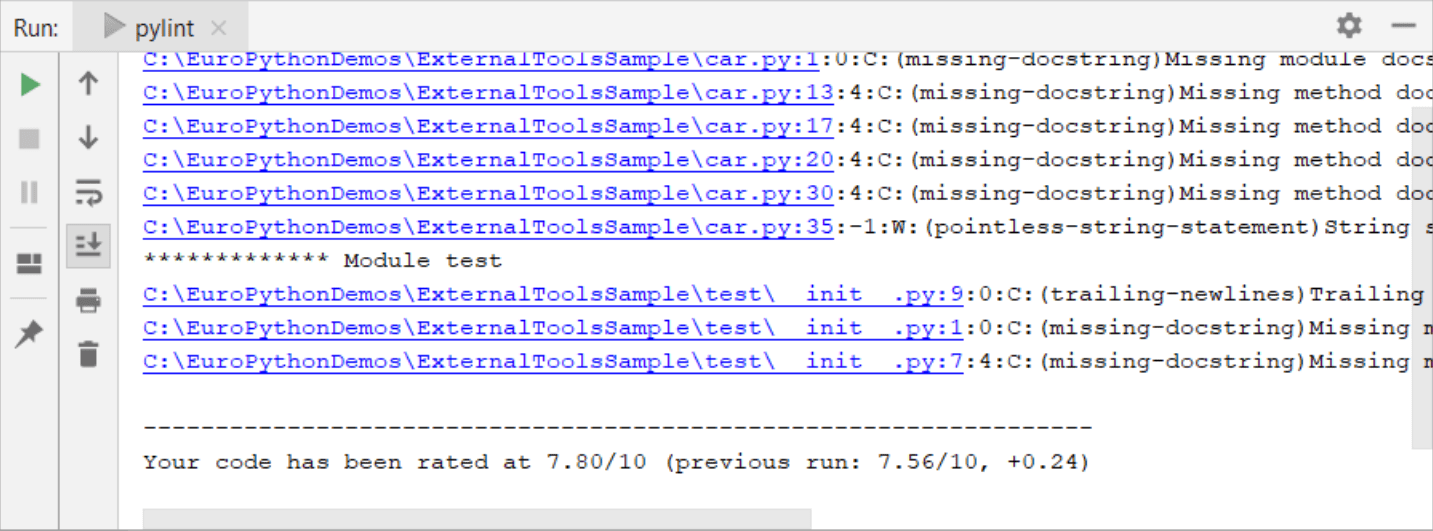
You can inspect the reported errors, click the corresponding links to navigate to the problematic code, and made the required changes.
Add a remote external tool
Remote SSH external tools are configured similarly to local external tools, but also define the remote server on which they are executed and require credentials for connecting to it via SSH.
This example demonstrates how to add date as a remote SSH external tool that is executed on a remote server and returns the current date and time on it.
Press Ctrl+Alt+S to open IDE settings and select Tools | Remote SSH External Tools.
Click
and specify the following settings:
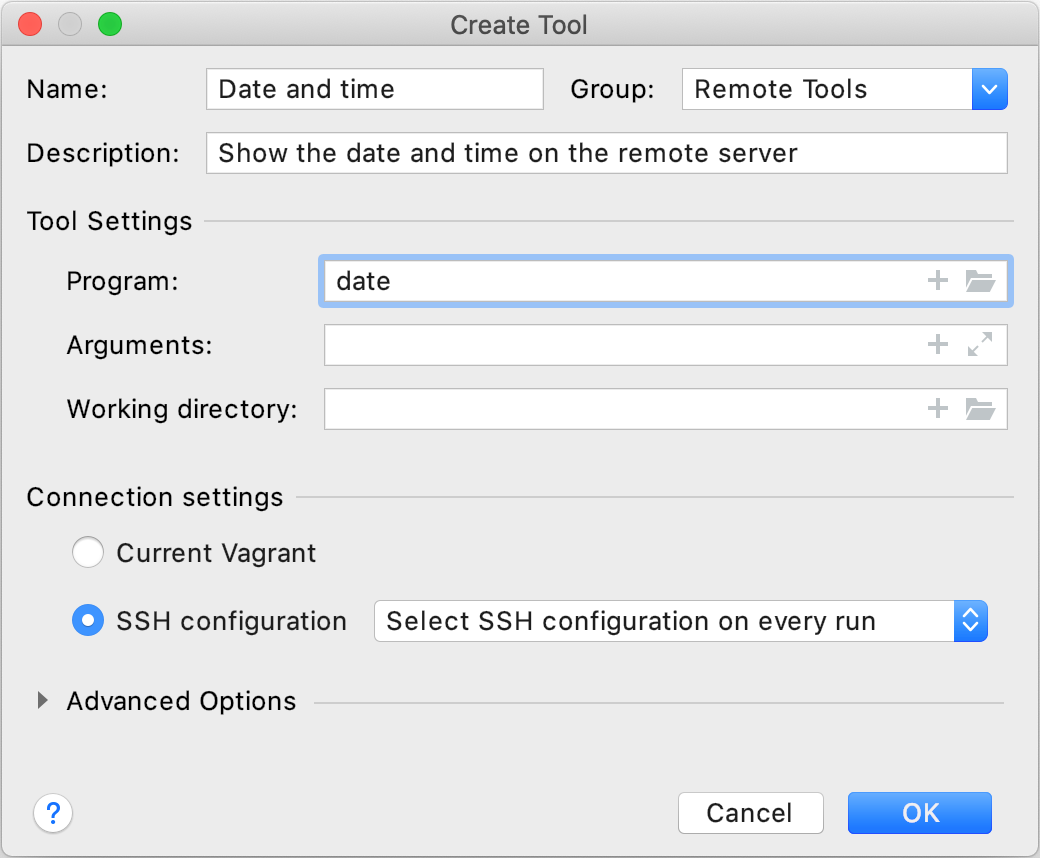
This dialog provides the same set of settings as when you add a local external tool, but selecting the remote server is also suggested.
This can be one of your configured SSH configurations or a Vagrant box.
By default, PyCharm will ask you for the host, port, and relevant SSH credentials every time you run the tool on the server.
Click OK to add the tool and then apply the changes.
Run the added tool on a remote server
From the main menu, select Tools | Remote tools | Date and time.
In the Settings/Preferences dialog Ctrl+Alt+S, select Keymap, find the
Date and timeaction, and assign a shortcut for it. Use the shortcut to run the tool.
After you specify the host, port, and credentials, PyCharm will connect to the server via SSH and run the date command, returning the output to the Run tool window in PyCharm.
Web browsers
You can use a web browser to open any file from your project. By default, it is used to preview the output of an HTML file or run and debug web applications.
Open a file in a web browser
To open a file that is intended to be rendered by a web browser (HTML, XML, JSP, and so on), do one of the following:
Press Alt+F2.
Right-click a file and select Open in Browser.
From the main menu, select View | Open in Browser.
Use the browser popup in the top right part of the editor window. Click the browser button to open the web server file URL, or Shift+Click it to open the local file URL.

The Open in Browser action is not available for other file types. However, you can still execute it using Find Action Ctrl+Shift+A.
View and configure the list of browsers
In the Settings/Preferences dialog Ctrl+Alt+S, select Tools | Web Browsers.
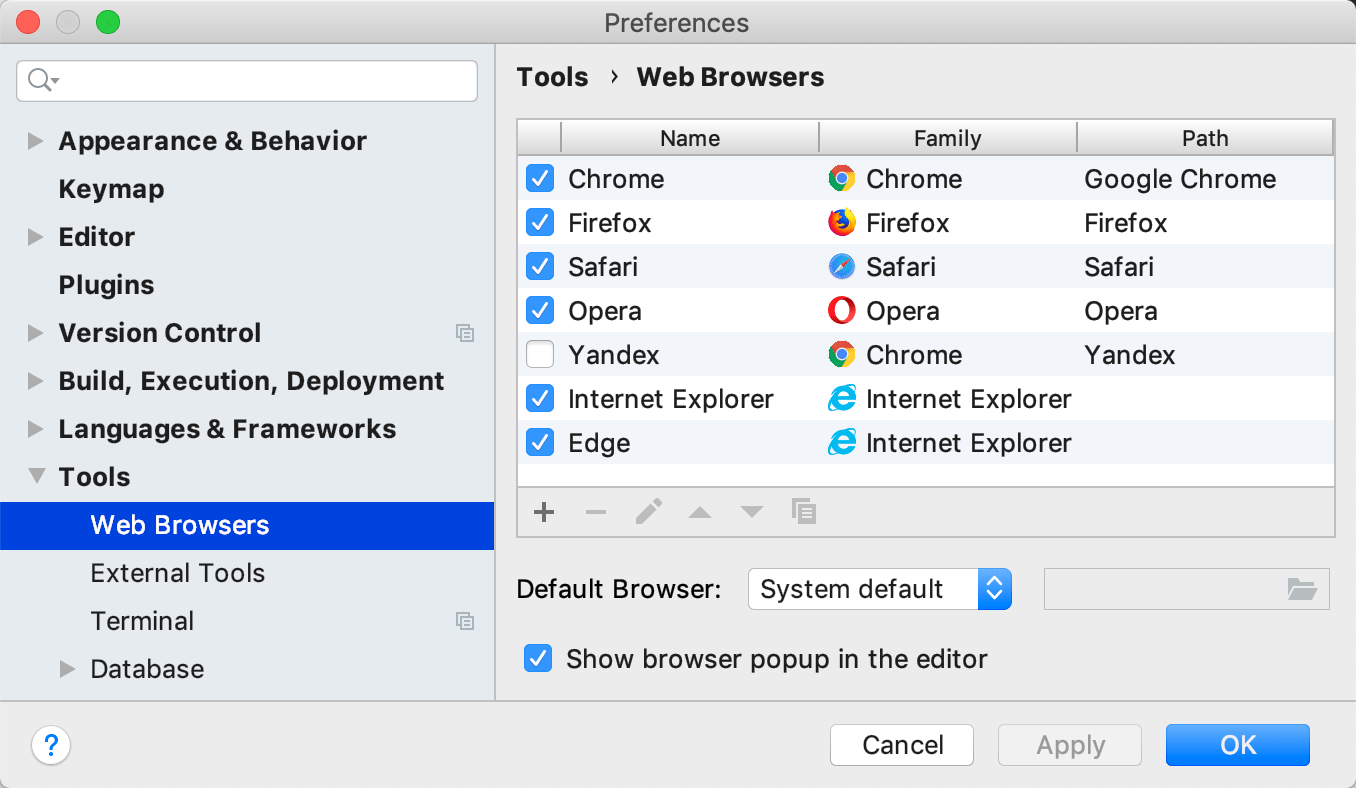
If a browser was installed using a standard procedure, the alias in the Path field should point to the right location. If it does not, specify the path to the corresponding executable file.
Use custom profile and settings
You can configure custom profiles for Firefox and Chrome family browsers.
In the Settings/Preferences dialog Ctrl+Alt+S, select Tools | Web Browsers.
Select the browser in the list and click
.
For Firefox, specify the path to the profiles.ini file and choose the profile to use. For more information, see Firefox browser profile.
For Chrome, select Use custom user data directory and specify the location of the user data directory.
You can also specify additional command-line options to use when running Chrome from PyCharm. For more information, open
chrome://flagsin the Chrome address bar.