Run notebooks and analyze dataProfessional
To preview and analyze data sets, you need to run the executable paragraphs of your notebook.
Running notebooks
You can run paragraphs one by one or all at once. When executing any paragraph, mind code dependencies. If, for example, the current paragraph relies on the variables that are initialized in the previous paragraph, it needs to be executed first.
Click
on the notebook editor toolbar to execute all paragraphs of the notebook, all paragraphs above or below the current one. The progress of the execution will be shown on the toolbar.
Click
icon in the gutter to execute a particular paragraph of the notebook.
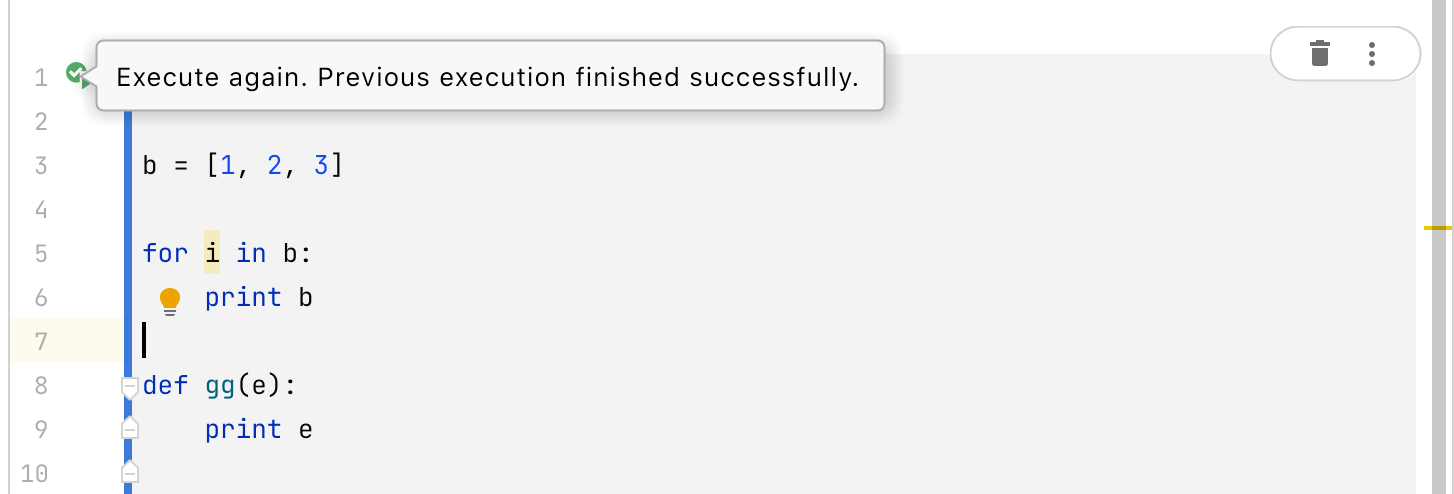
Once the execution completes, the execution status is shown in the toolbar and in the gutter:
: execution has been successfully finished
You can click this icon to execute the paragraph again.

: execution has failed
: execution has been aborted
note
You can enable notifications for the cases when the execution time exceeds the specified limit.
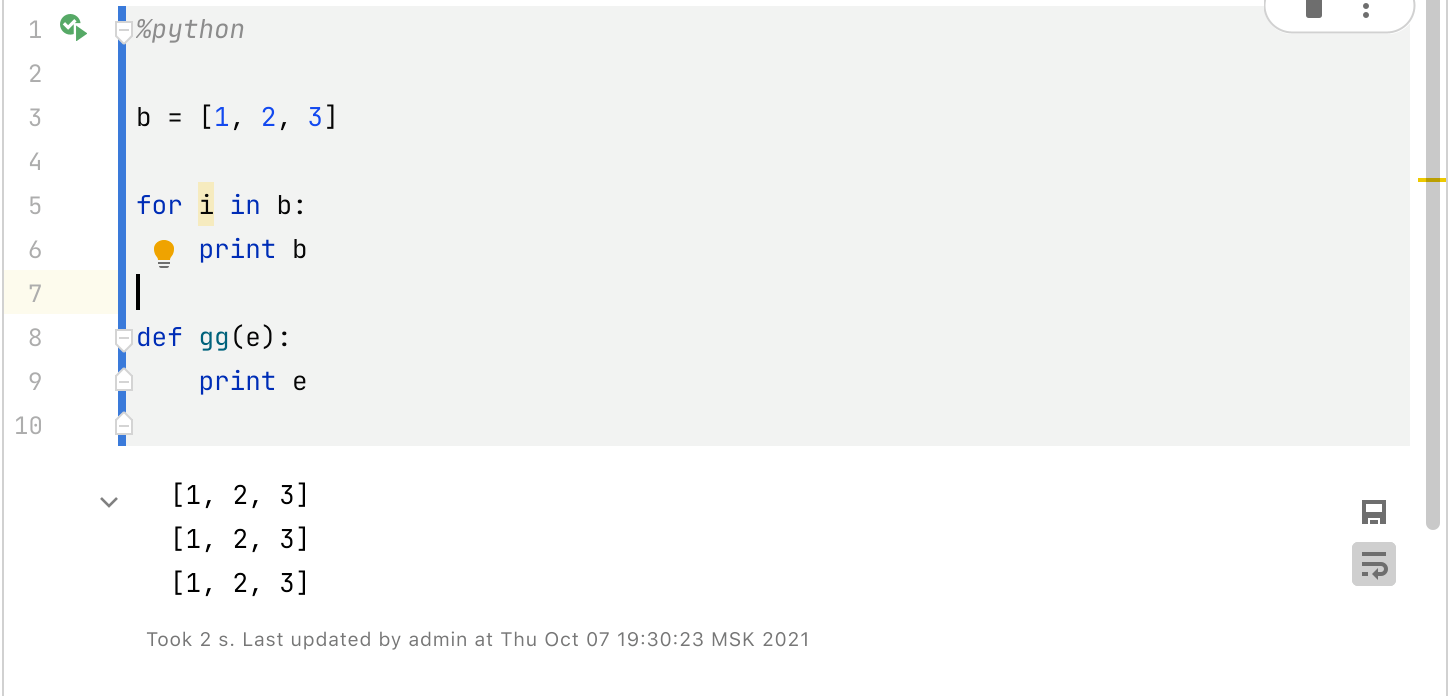
In case of the successful execution, preview the output that is shown below the paragraph code.

Refresh interpreters
When you execute code of your notebook, you might want to restart an interpreter on the target Zeppelin server. For your convenience, PyCharm provides several options to do this:
Click
on the notebook toolbar.
Right-click the Run icon in the gutter and select Restart Interpreter.

Right-click any paragraph in the editor and select Restart Interpreter from the context menu.
Viewing outputs
If your notebook processes data collections, you can preview output both in tabular and graphical forms. You can manage the output presentation by selecting a table, graph, or split view. Hover over the right side of the paragraph output to see the corresponding controls.

Organize data in the table
Click a column header to order values in it.
Click
to filter data in the selected column.
Click
 to organize table in pages. Toggle this button and specify the number of table rows to display on a page: 10, 15, 30, or 100.
Click
 and select the columns to be shown in the table.

Export tables
Click
 to save the table in a .csv file.
Enter the filename and click Save.
The default type of the chart is defined by the chart settings on the server. However, you can configure and modify the predefined chart type.
Configure charts
Click
 to alter the initial settings of the chart.
Click any icon that corresponds to a chart type and the new chart will be plotted. For example, click
 to add a new scatter chart.
Drag the columns you want to plot to the specific field:
 Gif
GifClick the Add new series link to add more series to the chart. Then drag the required columns to the target fields to set the axes.
Export charts
Click
 to save the generated graphical output in the .png format.
Enter the filename and click Save.
Configure chart settings
To define the way the chart looks, click
 on the chart toolbar (right side of the output area).
Select the contrast or default theme. Click
 to modify the theme colors. Also, you can click
  to clone the theme and customize it later.
Review the modified settings in the preview area and save the changes.
Viewing variables with ZTools
With an experimental feature, ZTools, you can preview local variables for the current Zeppelin session. ZTools is a Java library that establishes a protocol between the Zeppelin server and the IDE, and provides runtime information to get more details about the variables, and offers smart coding assistance.
In the Zeppelin connection settings, select the Enable ZTools Integration checkbox.

Download the ZTools library from https://dl.bintray.com/jetbrains/zeppelin-dependencies/org/jetbrains/ztools/ztools-spark-all/0.0.13/ztools-spark-all-0.0.13.jar.
Specify the downloaded library as a module dependency for the target Zeppelin connection. See the detailed instruction in Configuring dependencies.
Note that you must have permission to load Zeppelin dependencies. If you don’t have this permission, the Zeppelin server administrators must add the dependency on their side.
Open any notebook on the target Zeppelin server and execute any paragraph to collect data.
Once the paragraph is executed, the Variables tab appears in the Zeppelin tool window. You can also see the ZTools synced status in the notebook toolbar.

In the Variables tab, you can preview the values of the variables. You can right-click any variable to open a context menu and inspect the variable in a separate window with the Inspect ... command, or preview its value in text form (View Text).

At any time, you can click
to sync up with the server.
Troubleshooting
If, for some reasons, the execution of the notebook or a particular paragraph has failed, review the error message and consider some typical troubleshooting actions:
Problem | Recommended action |
|---|---|
The notebook toolbar is not available. The following warning message is shown: | Click the Try Reconnect link to get the notebook connected to the server. |
Server connection is lost. The corresponding icon shows the disconnected status of the server:  | Click |
Interpreter session gets expired. For example, the error message reports that the Spark session is expired. | Click |