Using Debug Console
The Debug Console enables you to view the output and error messages. You can optionally make command prompt available.
Opening the Debug Console
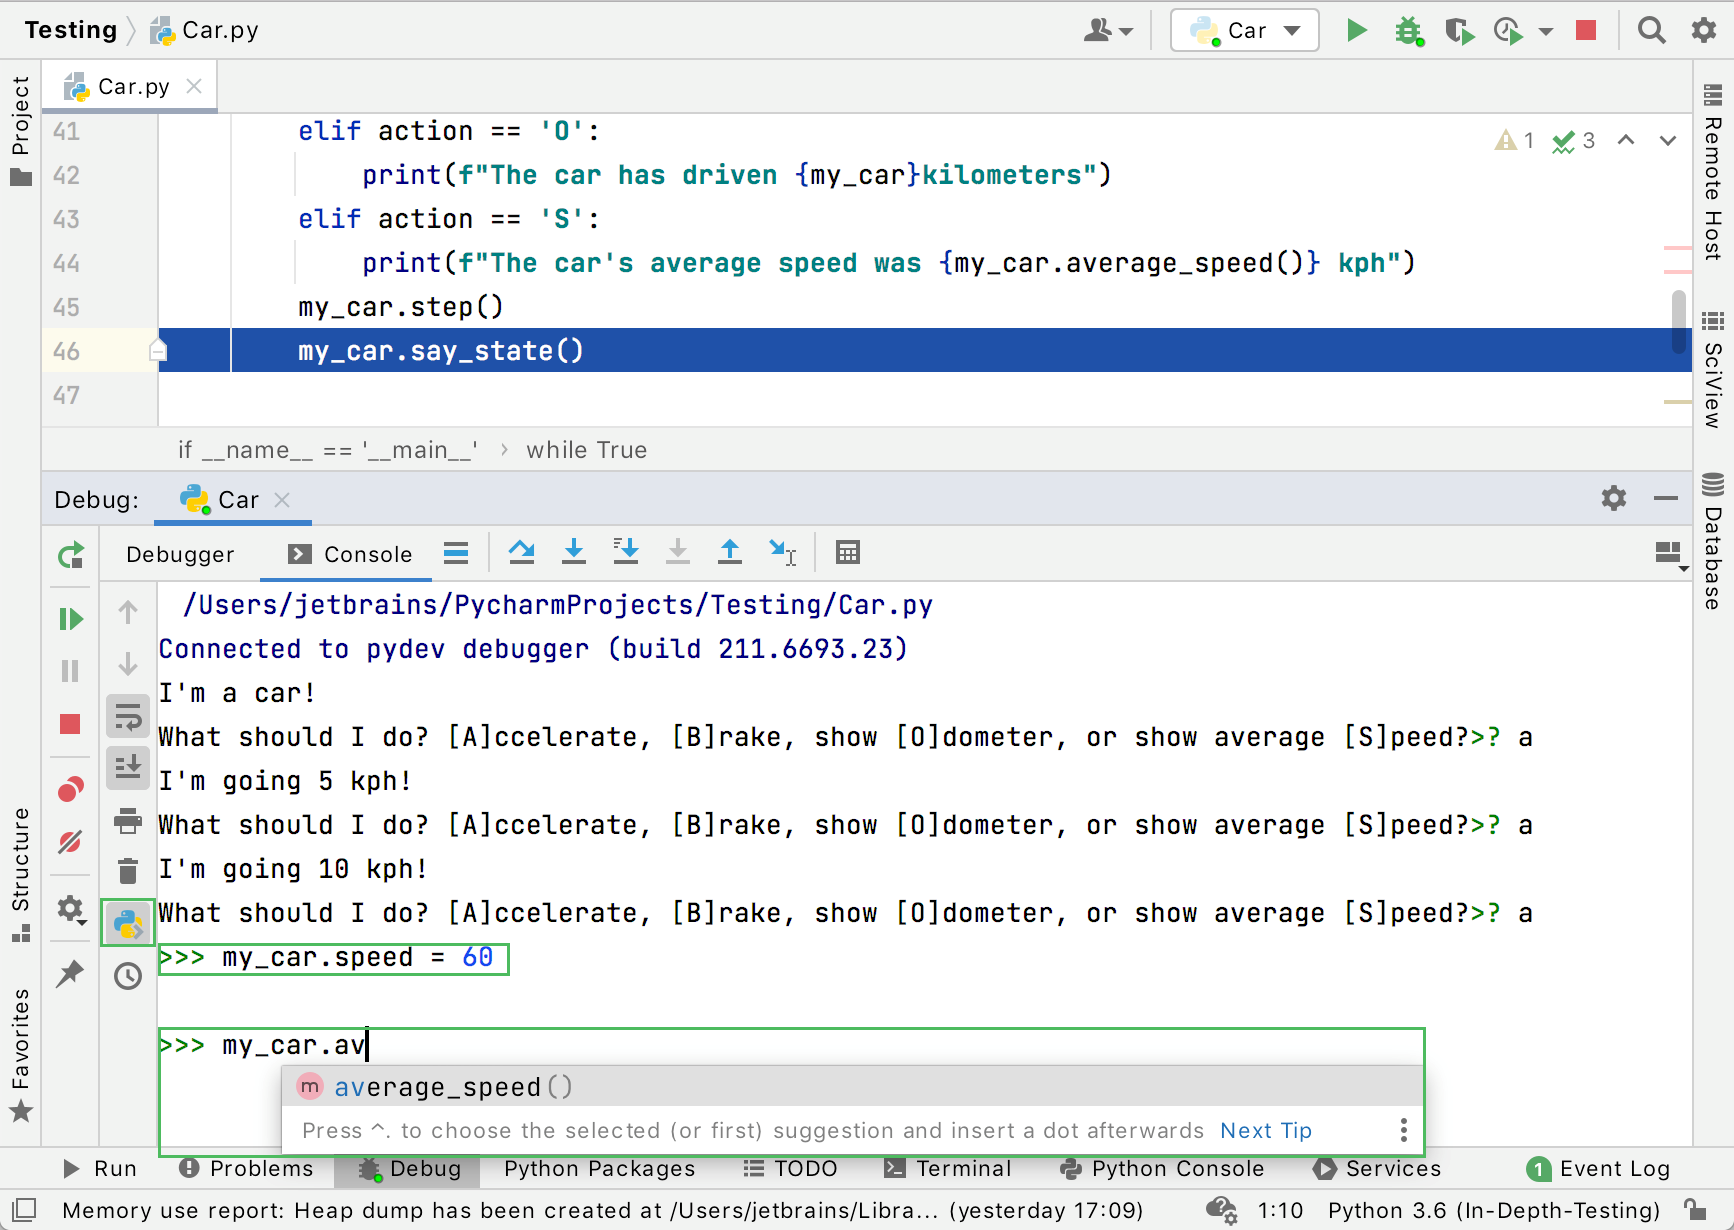
When you start the debugging session, PyCharm launches the debug console.
The console is interactive: it shows prompt, where you can type commands, execute them, and review results:

Actions available in the Python console
In an interactive console, you can:
Type commands in the lower pane of the console, and press Enter to execute them. Results are displayed in the upper pane.
Use basic code completion Ctrl+Space and tab completion.
Use
Up and Down arrow keys to scroll through the history of commands, and execute the required ones.
Load source code from the editor into console.
Use context menu of the upper pane to copy all output to the clipboard, compare with the current contents of the clipboard, or remove all output from the console.
Use the toolbar buttons
to control your session in the console.