Debug Django templates
Enable the Django plugin
This functionality relies on the Django plugin, which is bundled and enabled in PyCharm by default. If the relevant features aren't available, make sure that you didn't disable the plugin.
Press Ctrl+Alt+S to open settings and then select .
Open the Installed tab, find the Django plugin, and select the checkbox next to the plugin name.
Before you start, ensure that Django is specified as the project template language.
Prepare an example
Create a Django project
demoDjangoProject, with the applicationpoll.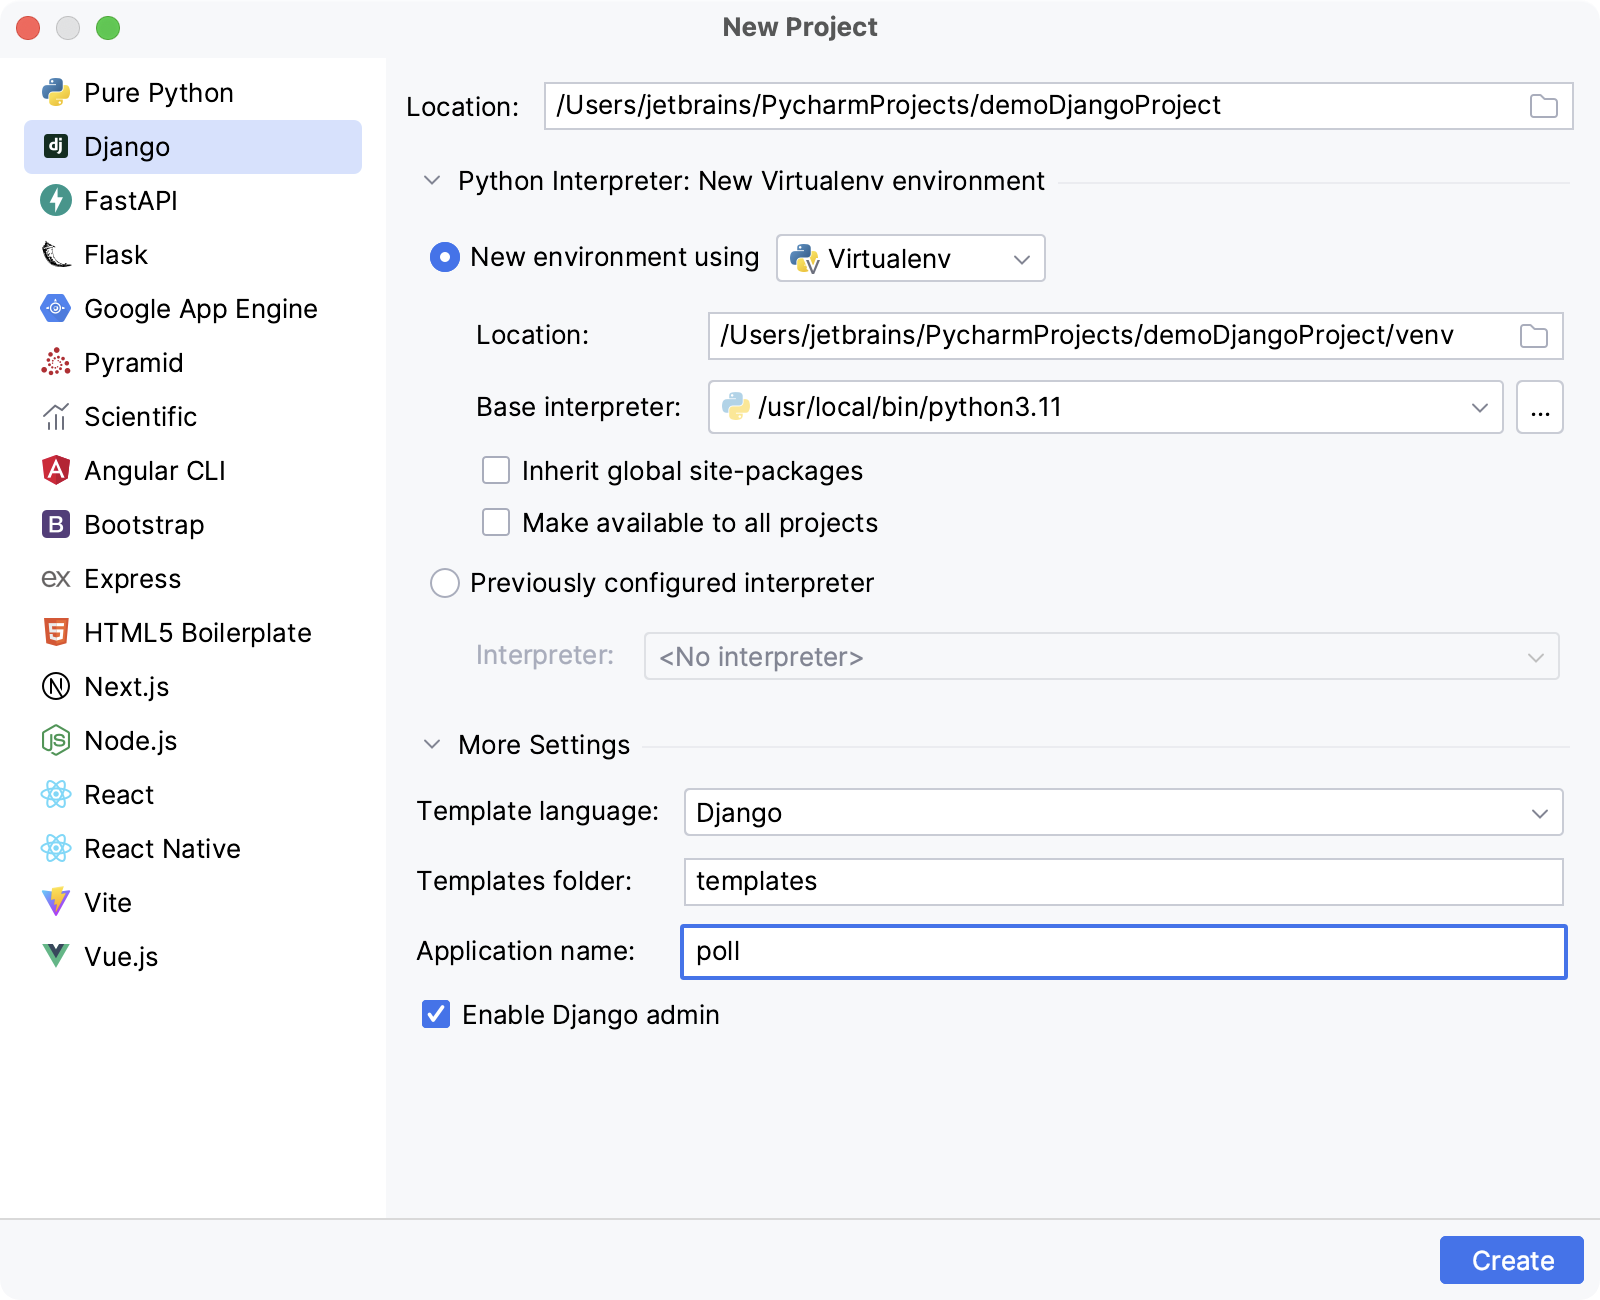
PyCharm creates the project structure and populates it with the necessary files.
Open the file poll/views.py. It already has the
importstatement and the invitation to create views for your application:from django.shortcuts import render # Create your views here.Let's define a view for the application's home page:
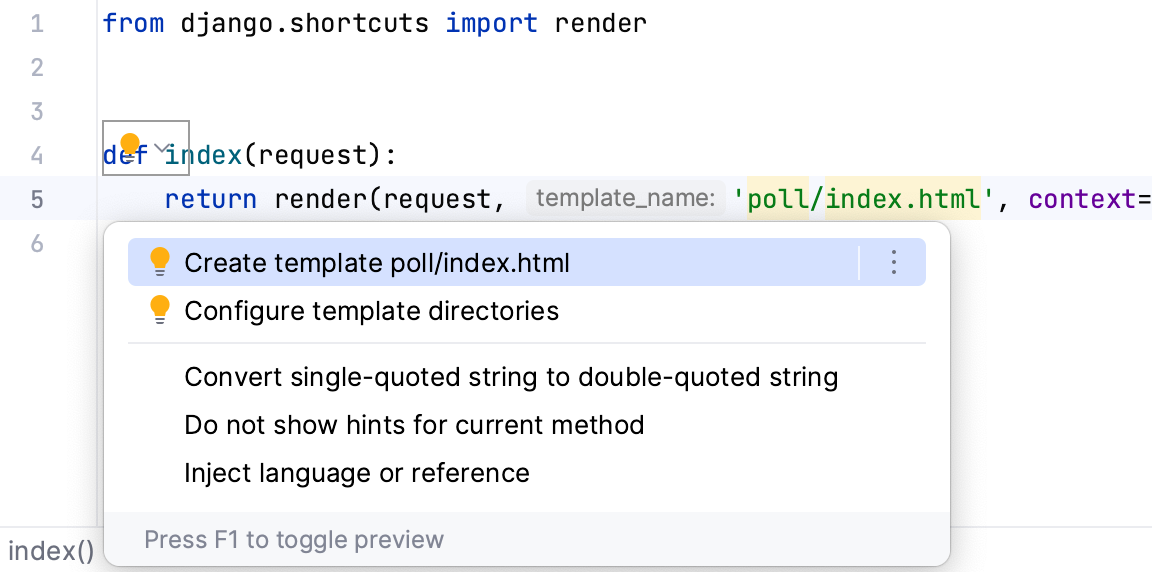
from django.shortcuts import render def index(request): return render(request, 'poll/index.html', context={'hello': 'world'})index.html is marked as an unresolved reference:

Press Alt+Enter or click
and choose to create the missing template:
Create Template dialog appears, showing the read-only template name (Template path field), and a list of possible template locations (Templates root field):

Select the template directory, where the new template will be created.
The Templates root field provides a list of possible locations for the new template. This list includes the template directories specified in the page of the IDE settings Ctrl+Alt+S plus all templates folders located inside of app directories, if any.
Click OK.
An empty .html file is created in the specified location
In templates/poll/index.html, type the following code to print out the value of the
hellovariable one character after another:{% for char in hello %} {{ char }} {% endfor %}According to the context provided in poll/views.py, the value of
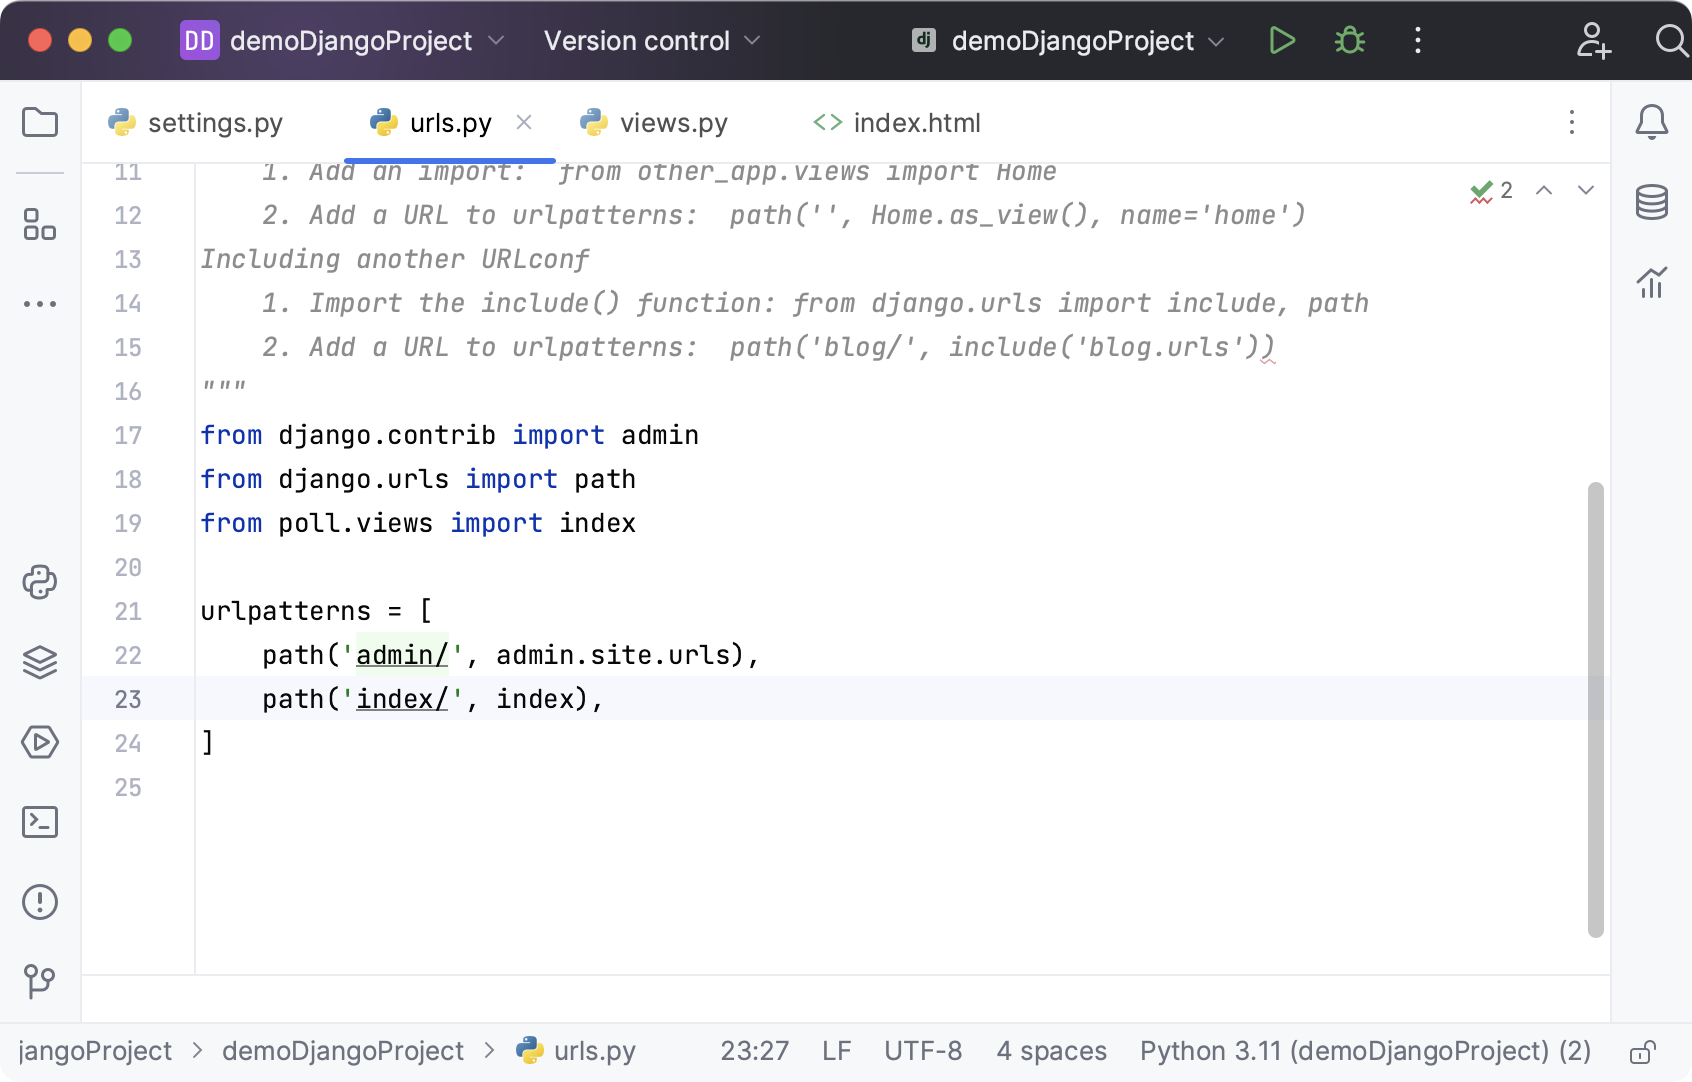
helloisworld. So, we expect the rendered page to containw o r l d.Open the demoDjangoProject/urls.py file.
In this file find
urlpatternsand add the following code to define which view should be used to render the index page:path('index/', index),Do not forget about the import statement!
from poll.views import indexYou should end up with the following:
So, the example code is ready.
Set a breakpoint
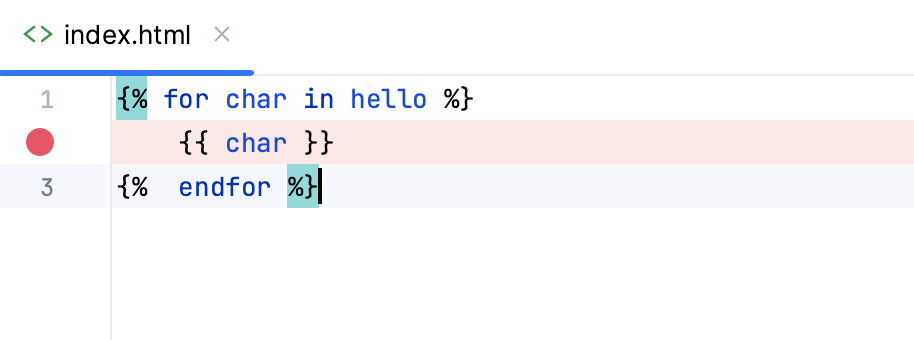
Add a breakpoint to the template file. To do that, open the file templates/poll/index.html and click the gutter:
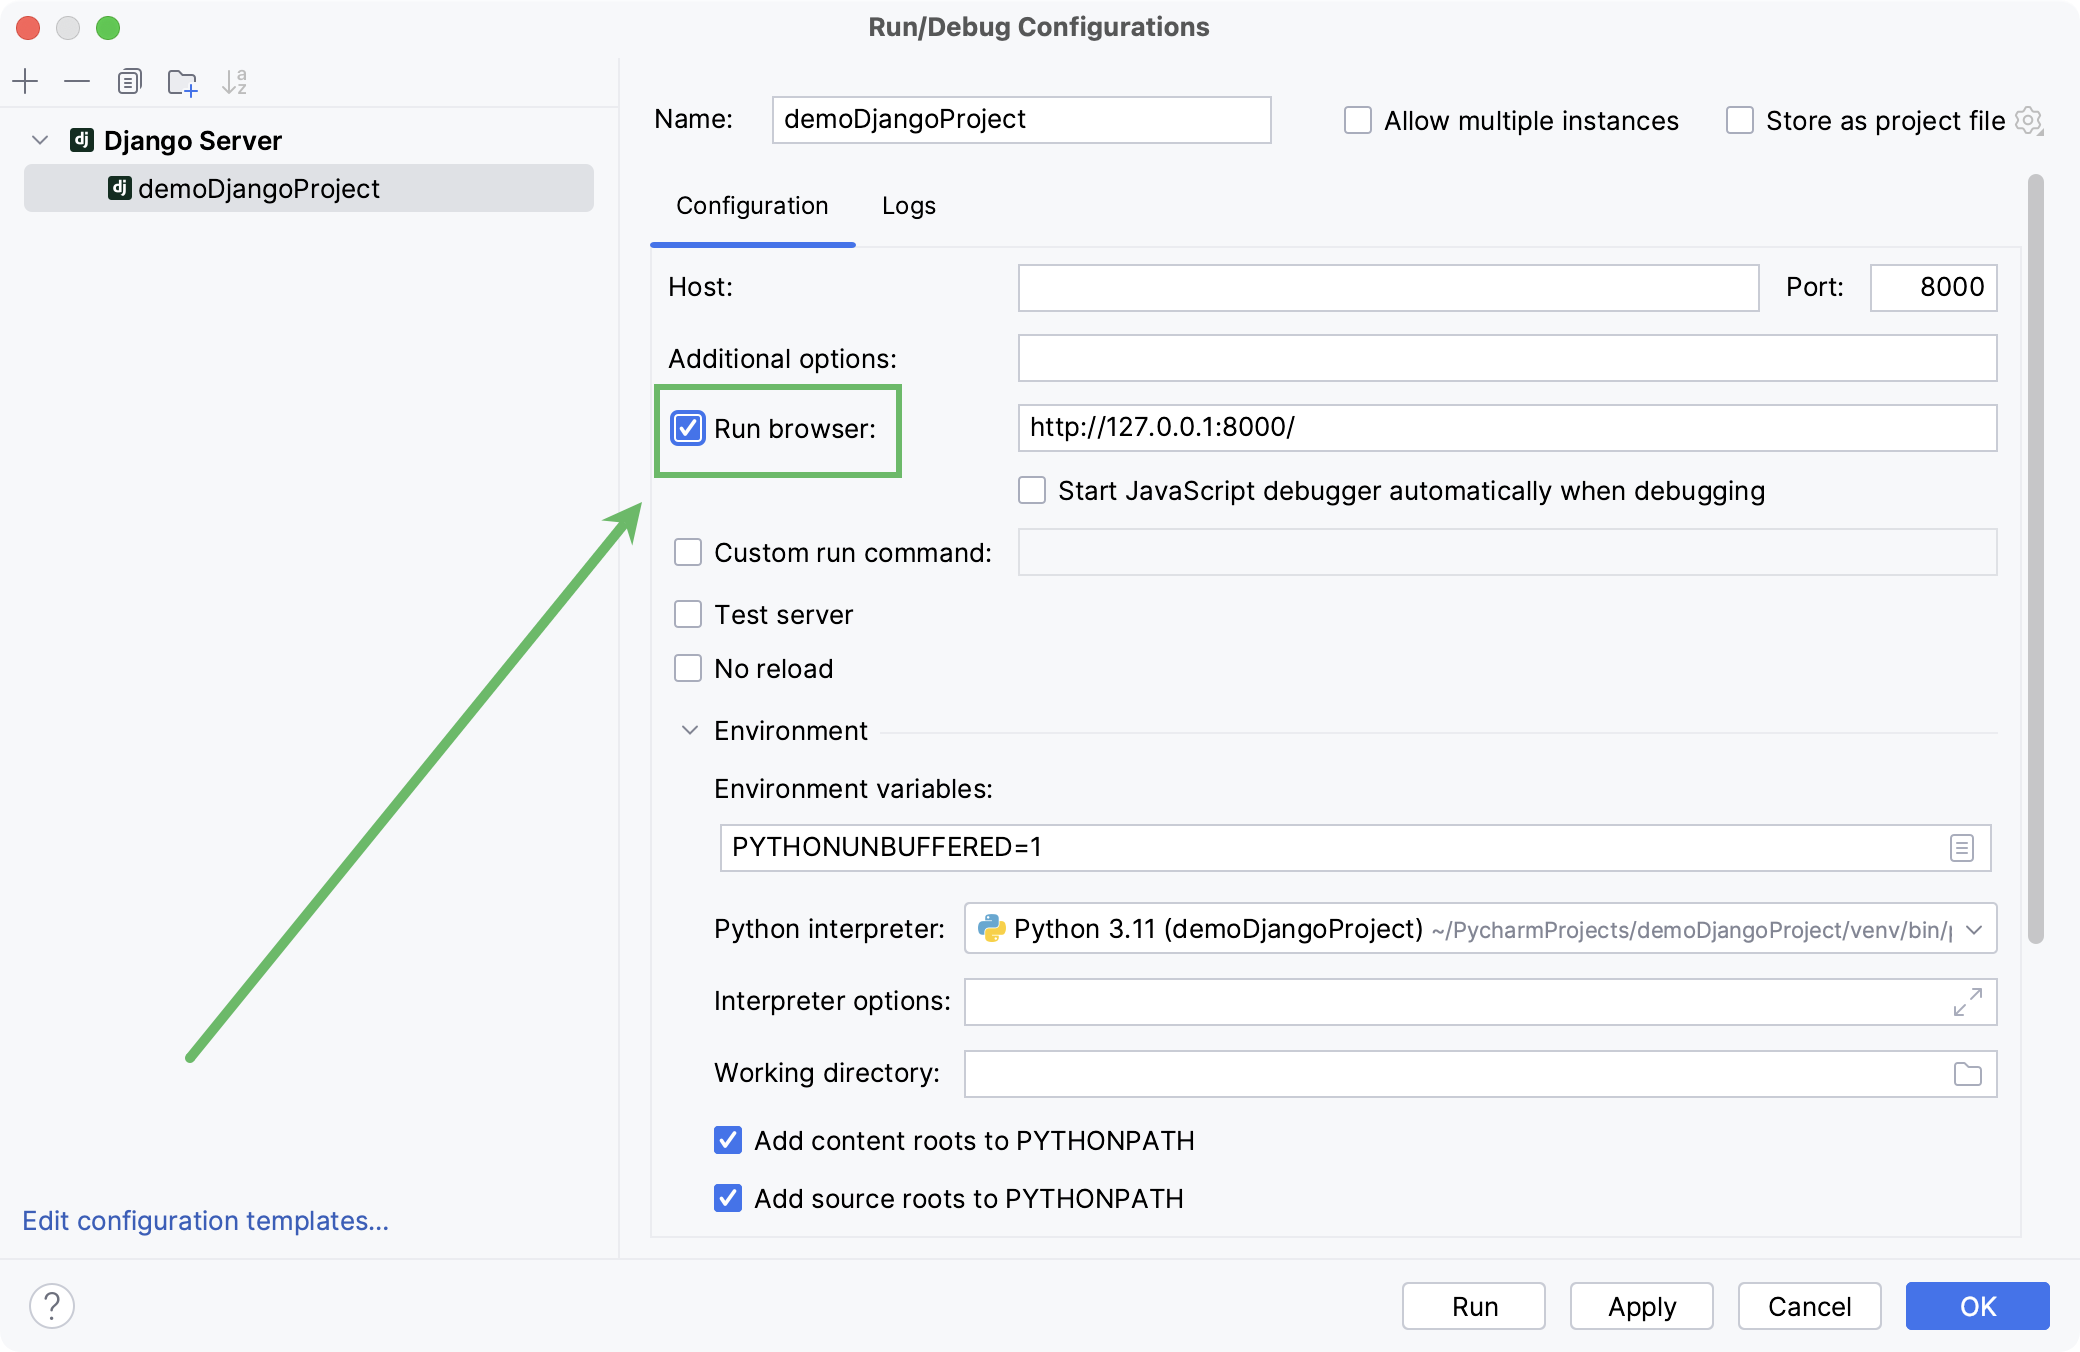
The Django server run/debug configuration is created automatically. If required, you can edit it by selecting the Edit Configurations command in the run/debug configuration list on the main toolbar:
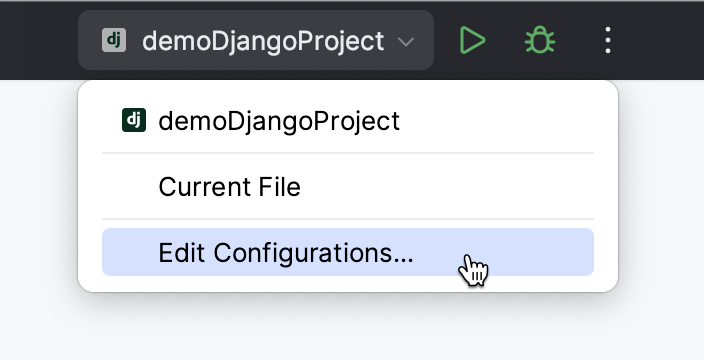
For example, you can choose to open a browser window automatically when the configuration is launched:
Launch a run/debug configuration
Launch the selected run/debug configuration in the debug mode by clicking
.
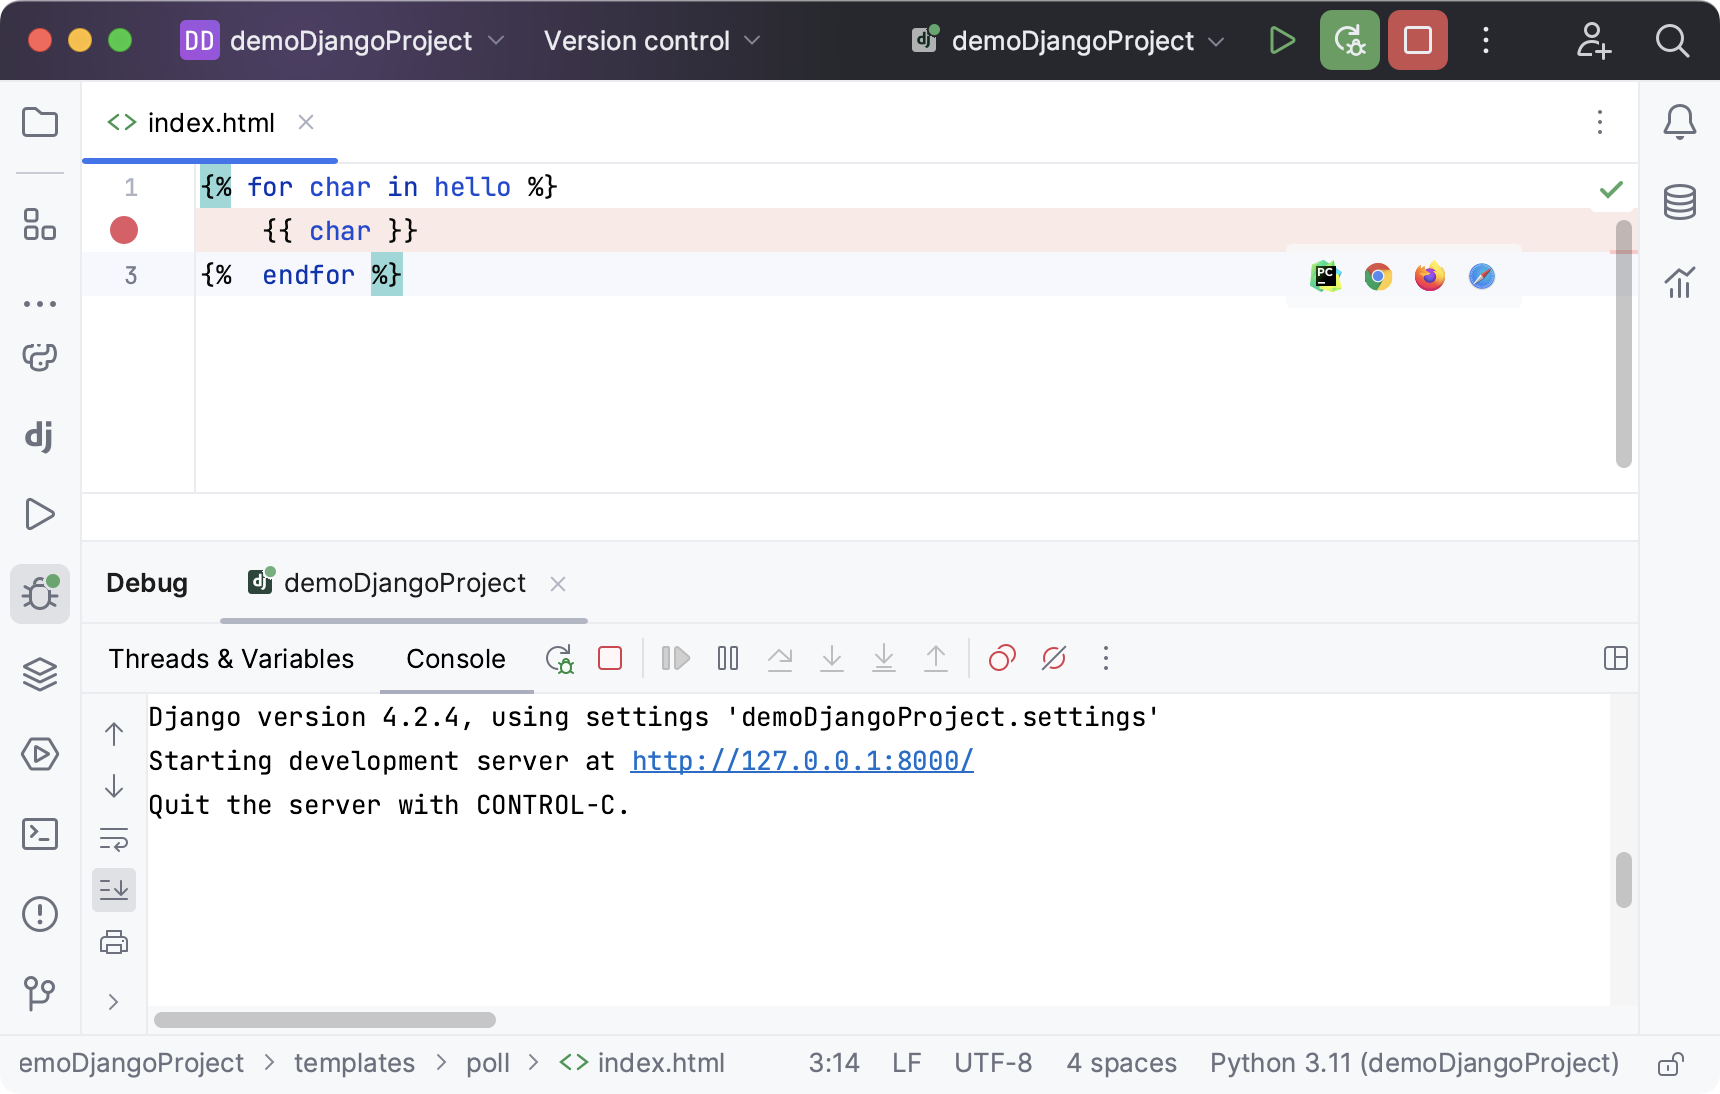
Click the link in the Debug tool window. A browser window will open with a Page not found message:
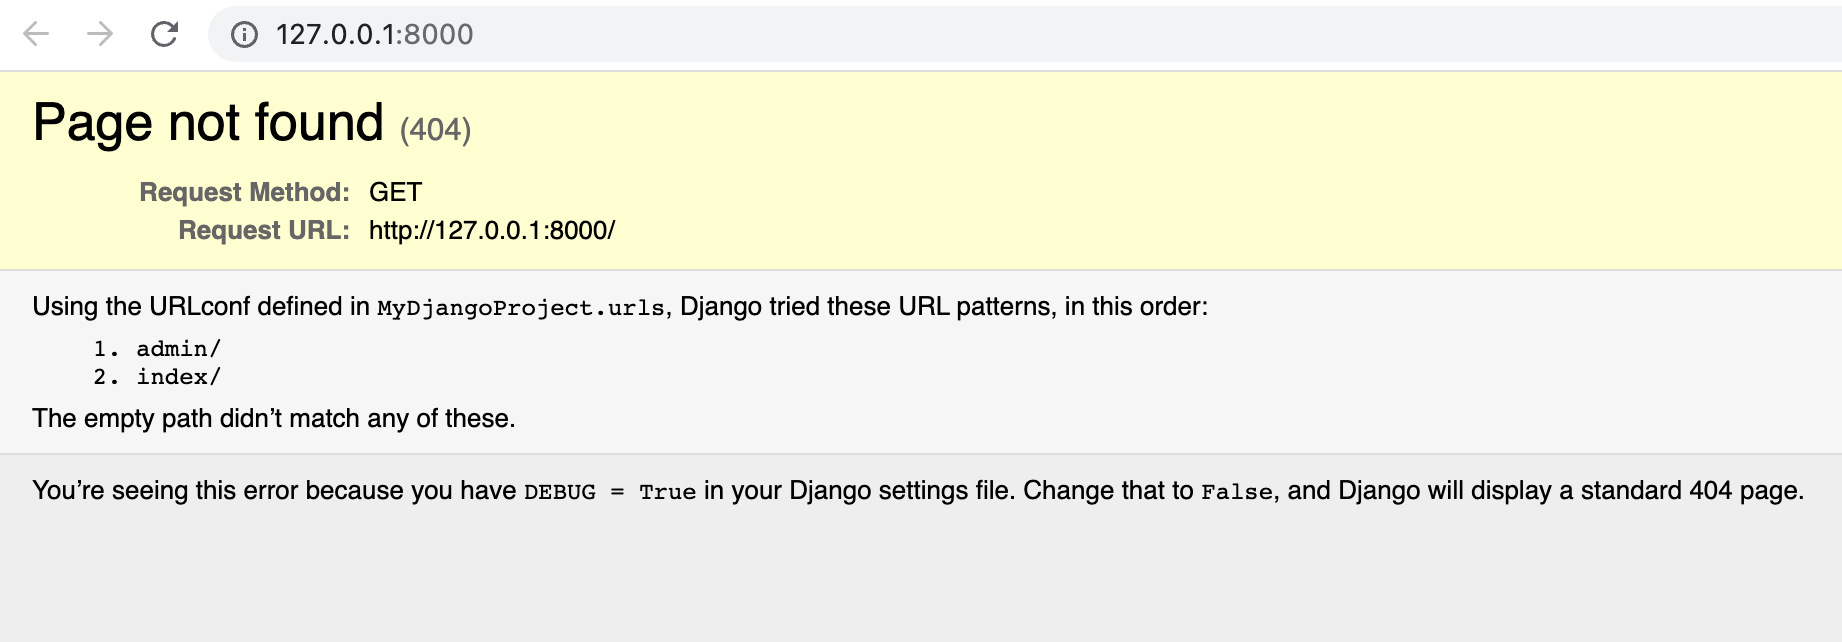
It happens because we didn't specify a path for
'/'in the file urls.pyLet's add
/indexin the browser address bar and press Enter.
The PyCharm window appears. You can see that the breakpoint has been hit, and the Debug tool window contains the current values of the variables in the Threads & Variables tab:
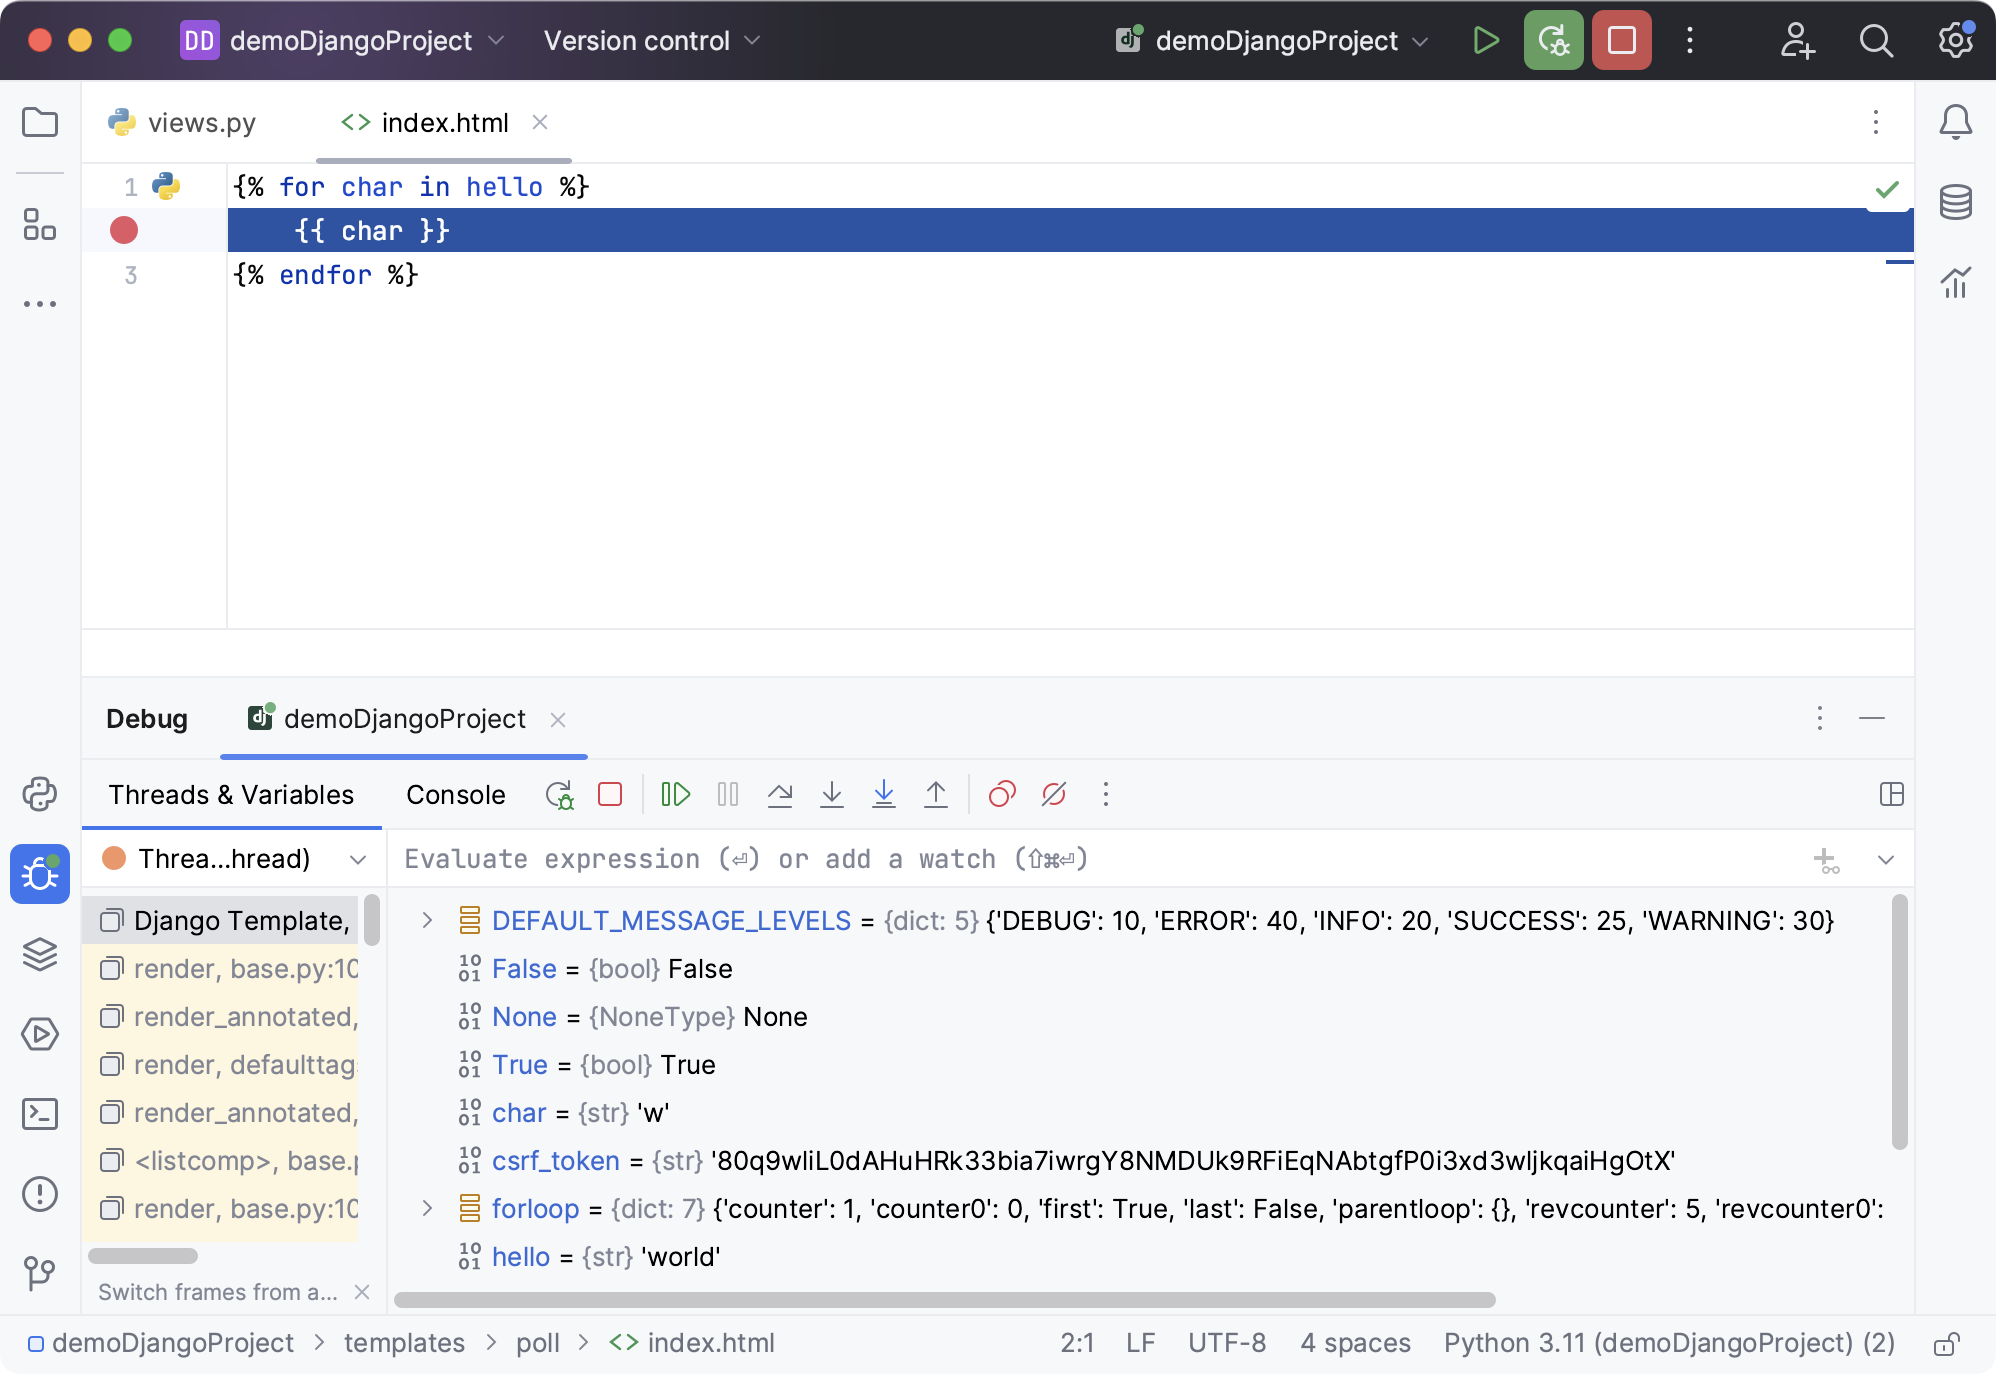
The Debug tool window for Django applications has all the functions, similar to pure Python scripts:
Stepping through the program
The stepping toolbar is active, and the stepping buttons are available. For example, you can click
and see that the value of the
charvariable changes to the next letter of the wordworld.For more information, refer to Step through the program.
Evaluating expressions
Press Alt+F8, or click
on the stepping toolbar, and then select
Evaluate expression. In the dialog that opens, type the expression you wish to evaluate, and click Evaluate:
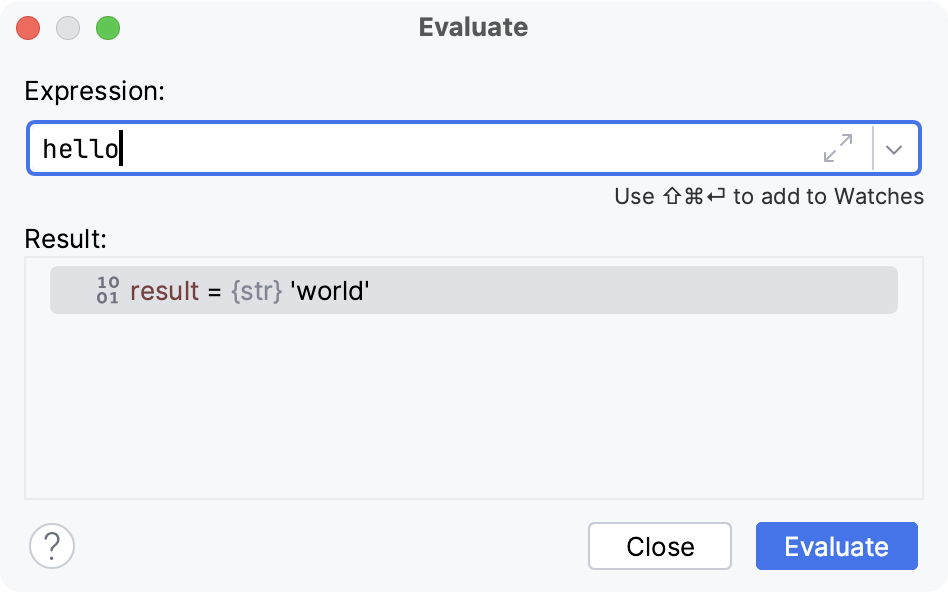
For more information, refer to Evaluate expressions.
Watching variables
Suppose, you'd like to always keep an eye on a certain variable of a template, say,
char. How to do that?At the top of the Debugger tab of the Debug tool window, type the name of the variable of interest, and press
:

The value of the variable will be displayed at the top of the variable list through the rest of the debugging process. For more information, refer to Watches.
That's it... What has been done here? Let's repeat:
You've created a Django project, with a template in it.
You've added a breakpoint to this template.
You've launched the Django server run/debug configuration in the debug mode.
Having hit the breakpoint, you've learned how to step through your template, evaluate expressions, and add watches.