Python console
Python console enables executing Python commands and scripts line by line, similar to your experience with Python Shell.
Working with Python console
The console appears as a tool window every time you choose the corresponding command on the menu. You can assign a shortcut to open Python console: press Ctrl+Alt+S, navigate to Keymap, specify a shortcut for .
The main reason for using the Python console within PyCharm is to benefit from the main IDE features, such as code completion, code analysis, and quick fixes.

You can use up and down arrow keys to browse through the history of executed commands, and repeat the desired ones. To preview the variable values calculated in the course of the execution, click and check the Special Variables list.

The console is available for all types of Python interpreters and virtual environments, both local and remote.
View data structures
When viewing variables in the Python Console, you can click View as Array, View as DataFrame, or View as Series links to display the data in the Data View tool window.

By default, the new table representation is used. Click
Switch Between Table Representations to change the table interface.

Click
Table Coloring Options to toggle and configure cell coloring .

Run source code from the editor in console
Open file in the editor, and select a fragment of code to be executed.
From the context menu of the selection, choose Execute Selection in Python Console, or press Alt+Shift+E:
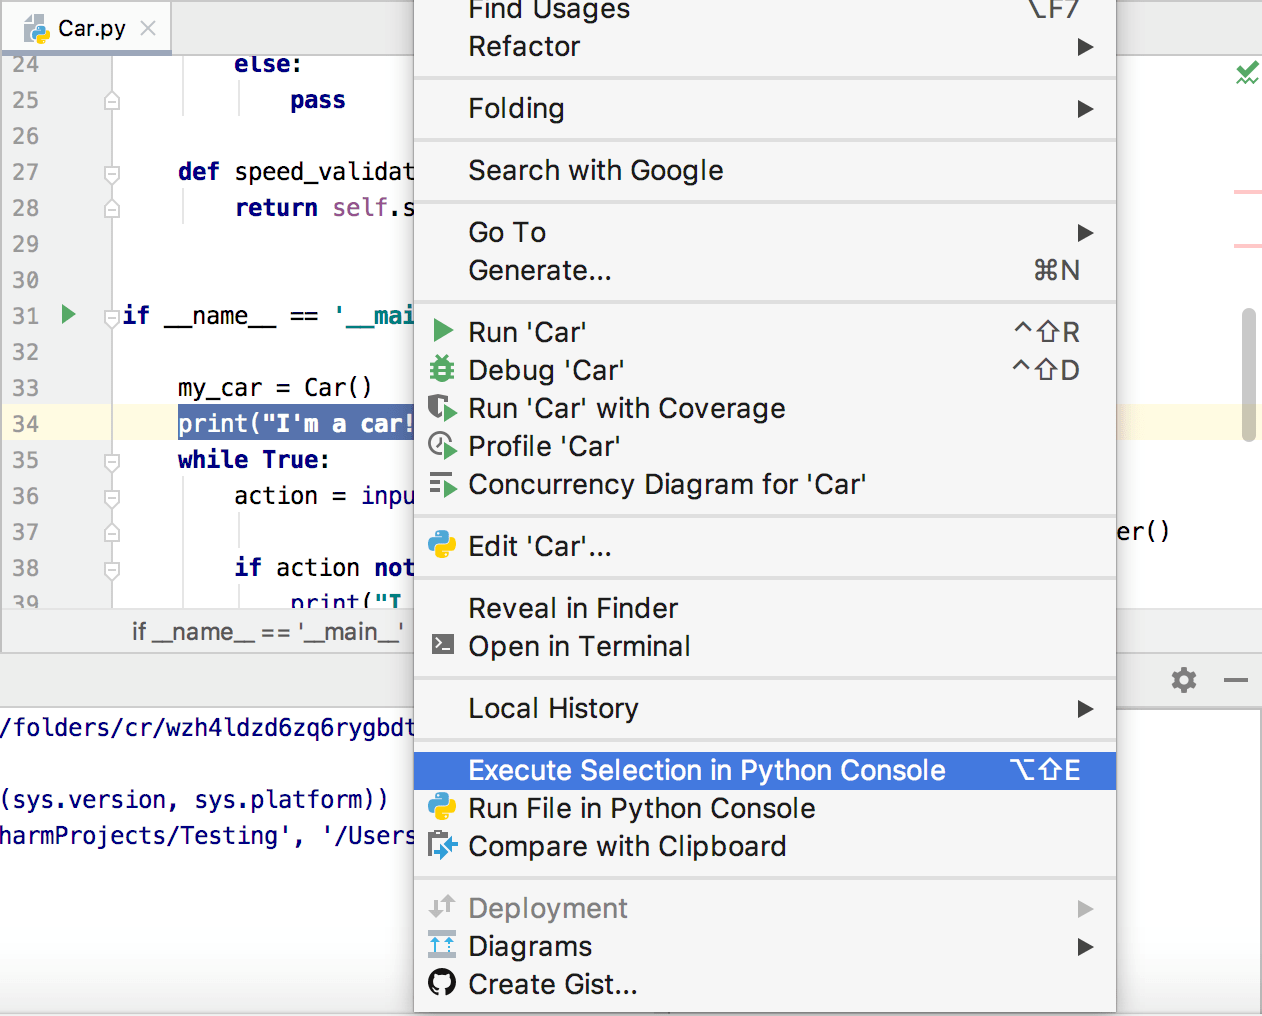
Watch the code selection execution:

By default, the Python console executes Python commands using the Python interpreter defined for the project. However, you can assign an alternative Python interpreter.
Run asyncio coroutines
In the editor, select a fragment of code which contains the definition of an asyncio coroutine.
From the context menu, select Execute Selection in Python Console, or press Alt+Shift+E:
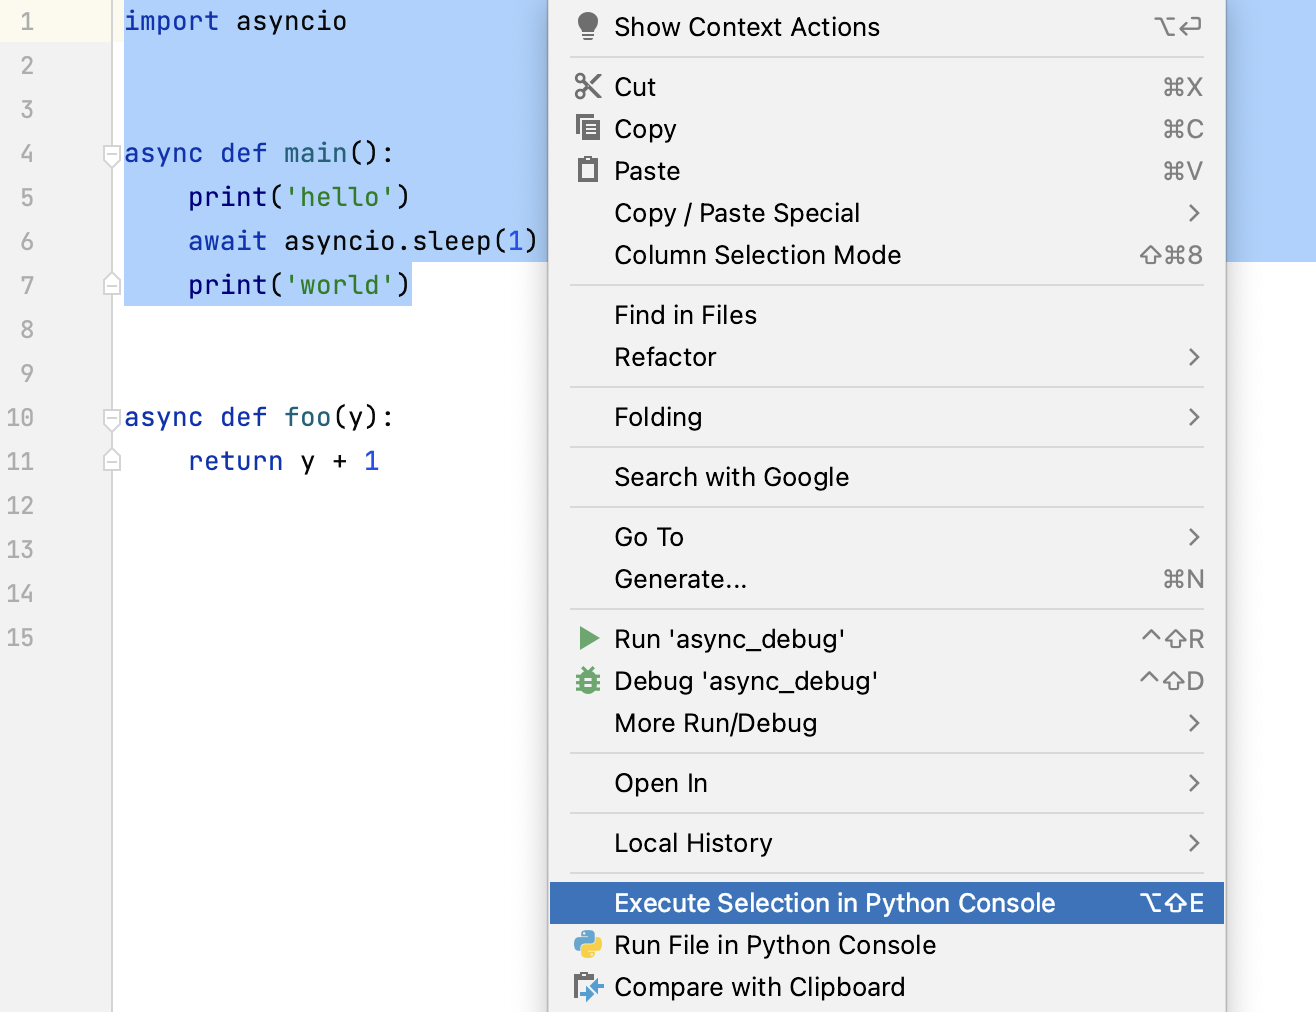
After the code is executed on the Python console, run the coroutine by using the
awaitkeyword: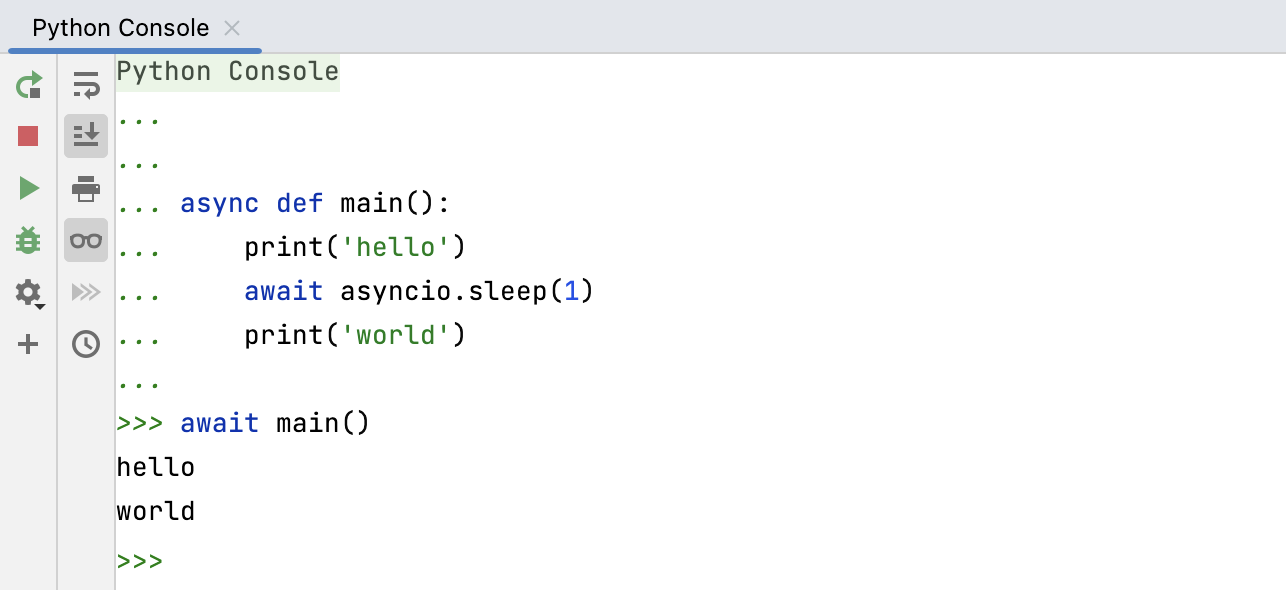
Configure Python console settings
In the Settings dialog (Ctrl+Alt+S) , select .
Select any available interpreter from the Python interpreter list. Note that you cannot introduce a new interpreter here. If you want to come up with the new interpreter, you need to create it first.
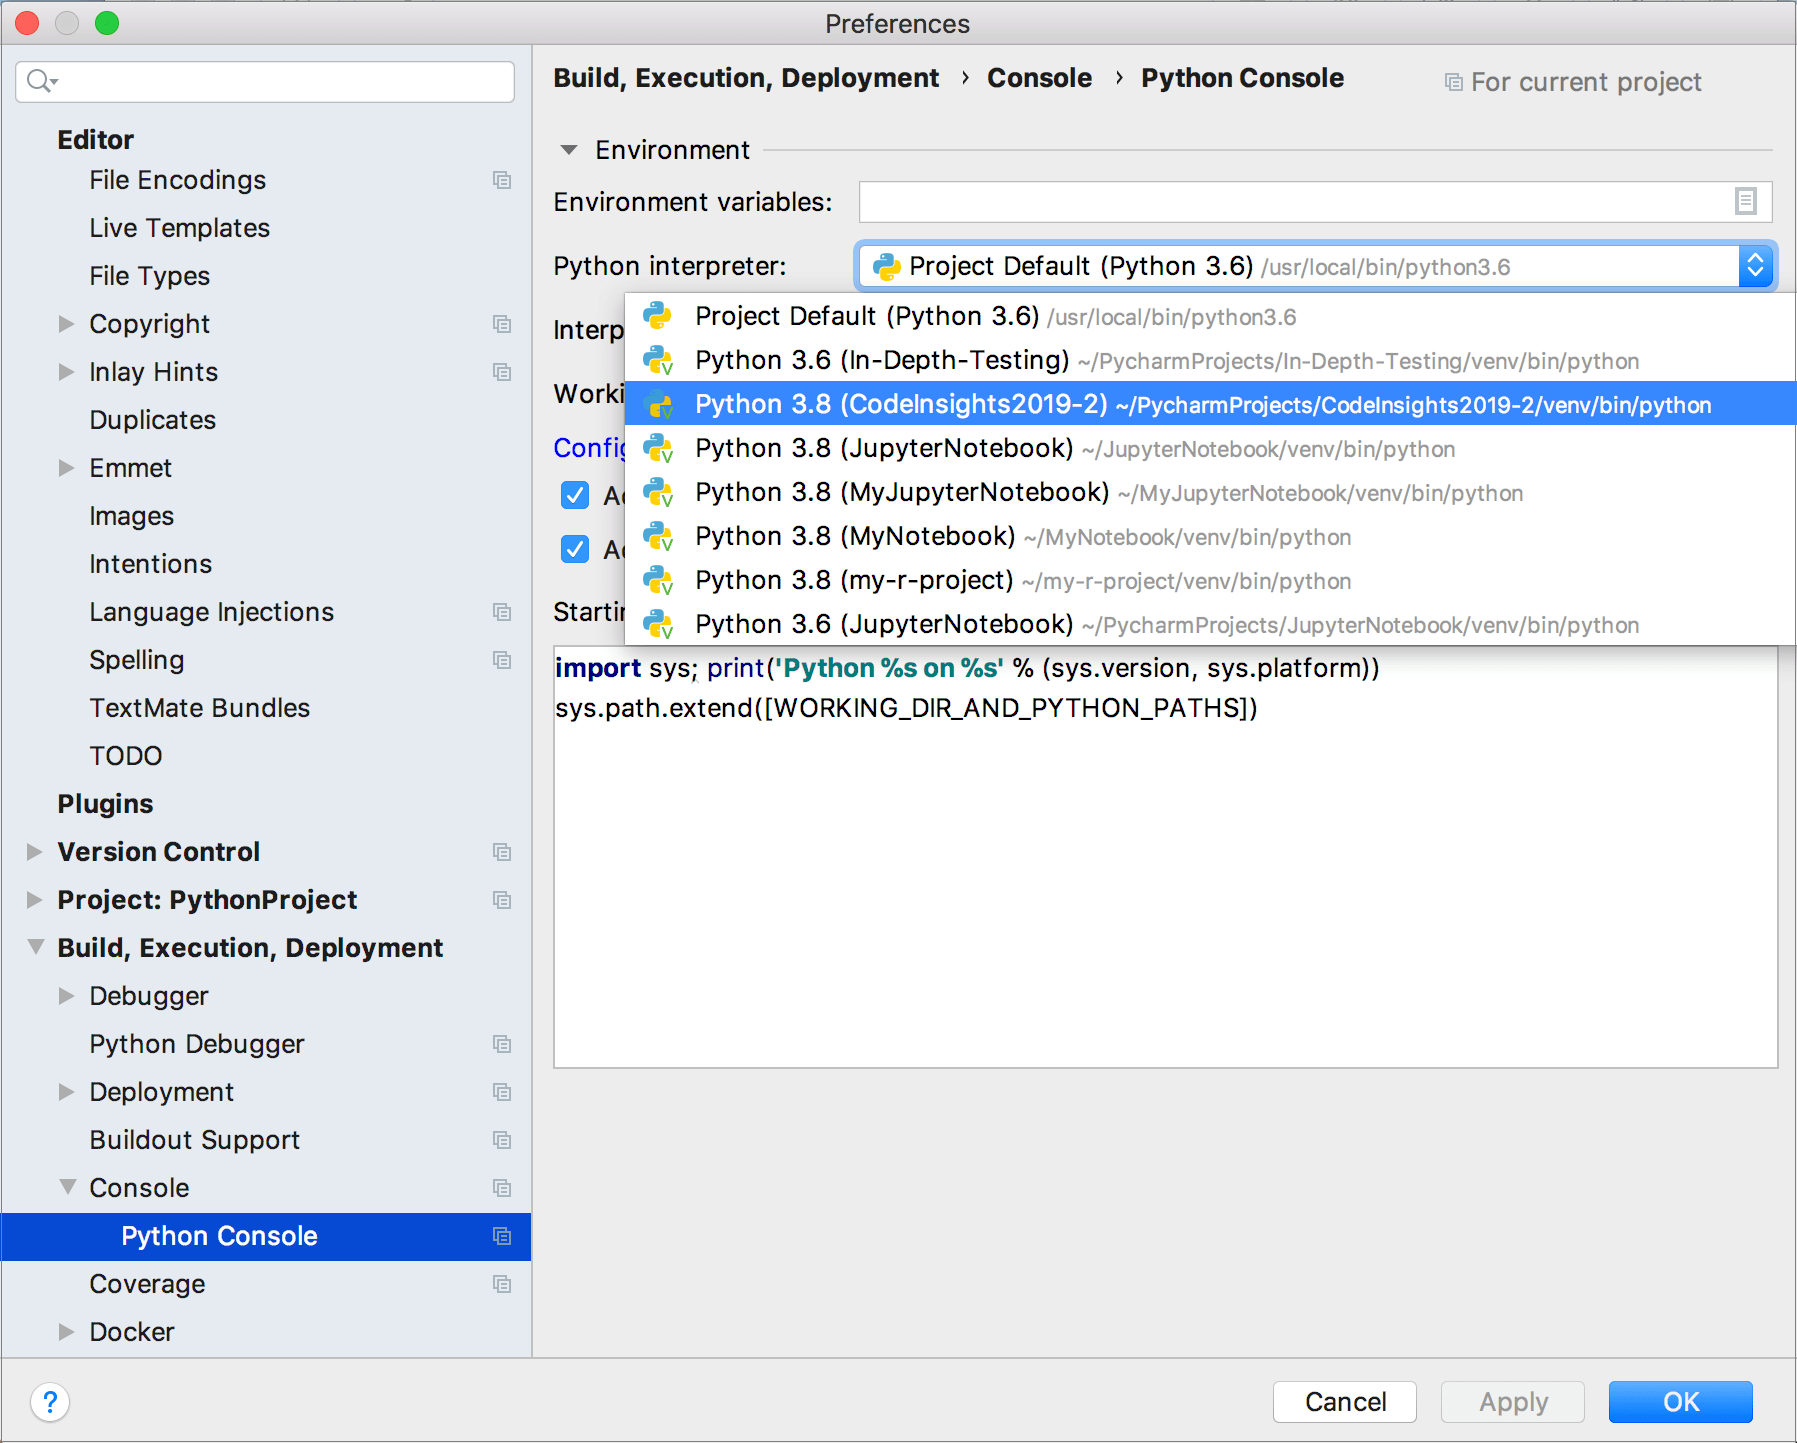
In needed, click the Configure Interpreters link to inspect the list of the installed packages and add new ones.
Mind the code in the Starting script area. It contains the script that will be executed after you open the Python console. Use it to pre-code some required Python commands.
When working on several Python scripts, you might want to execute each in a separate Python console.
Run several Python consoles
Click
to add a new Python console.
By default, each console has the name Python Console with an index. To make a console reflect the script you're running, right-click the console tab, select Rename Console, and enter any meaningful name.
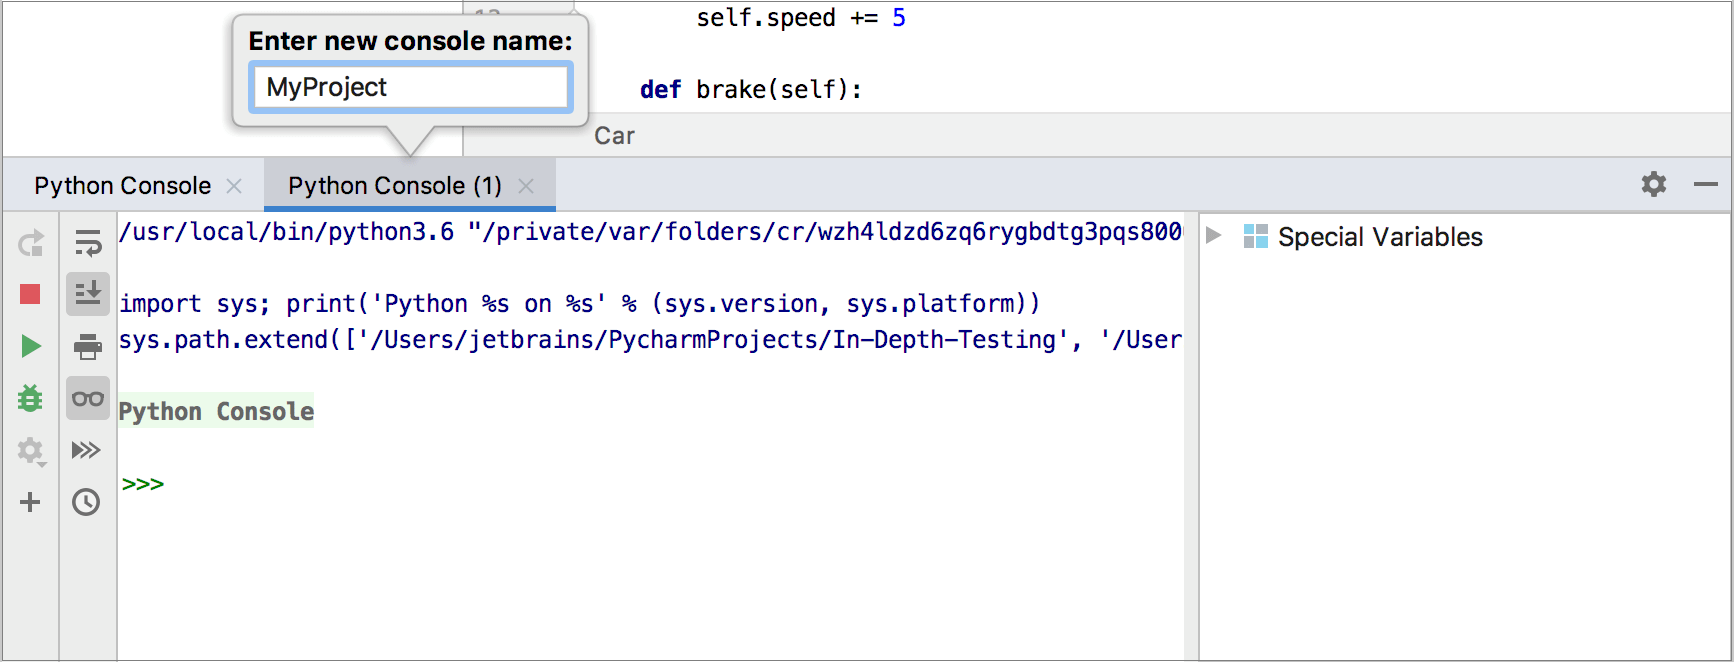
All the commands you're running in the Python console are executed one by one. If the commands require substantial time to get executed, you might want to preview and manage the execution queue.
Manage the command execution queue
Go to and enable the Command queue for Python Console checkbox.
Click
on the console toolbar to open the queue.

In the Python Console Command Queue dialog, review the list of commands. If needed, click
to delete the command from the queue.
Note, once the command is executed, it disappears from the queue. To preview all previously executed commands browse the console history ().
Toolbar
Item | Tooltip and shortcut | Description |
|---|---|---|
Rerun console Ctrl+F5 | Click this button to terminate the current process and launch the new one. | |
Stop Ctrl+F2 | Click this button to stop the current process. Clicking the button once invokes soft kill allowing the application to catch the | |
Execute Current Statement Enter. | Click this button to execute the command at caret, entered in the input pane of the console. | |
Attach Debugger | Attaches the debugger process to the console. | |
Settings | You can specify the following settings of the Python console:
| |
New Console | Click this button to start a new console session. | |
Use Soft Wraps | Click this button to toggle the soft wrap mode of the output. | |
Scroll to the end | Click this button to navigate to the bottom of the stack trace and have the caret jump to the corresponding location in the source code. | |
Click this button to send the console text to the default printer. | ||
Show variables | Click this button to show in a separate pane the variables declared in the console. Right-click a variable in this pane reveals a context menu. | |
Show Command Queue | Click this button to preview the command execution queue. | |
Browse History Ctrl+Alt+E | Open a dialog that shows all the statements that you have run for the corresponding data source. See also, Use the Query History dialog. |
Context menu commands
Command | Shortcut | Description |
|---|---|---|
| Show selection in the console and contents of the Clipboard in the Diff Viewer. | |
Pause Output | Pause the Python script execution output | |
| Choose this item from the context menu to delete all messages from the upper part of the console. |