Configuring JavaScript debugger
PyCharm provides a built-in debugger for your client-side JavaScript code. The built-in debugger starts automatically when you launch a debugging session.
To ensure successful debugging, it is enough to specify the built-in web server port and accept the default settings that PyCharm suggests for other debugger options.
Before you start
Make sure the JavaScript and TypeScript bundled plugin is enabled in the settings. Press Ctrl+Alt+S to open settings and then select . Click the Installed tab. In the search field, type JavaScript and TypeScript. For more information about plugins, refer to Managing plugins.
Make sure the JavaScript Debugger bundled plugin is enabled in the settings. Press Ctrl+Alt+S to open settings and then select . Click the Installed tab. In the search field, type JavaScript Debugger. For more information about plugins, refer to Managing plugins.

Set the built-in web server port
PyCharm has a built-in web server that can be used to debug your application in a web browser or preview your code in the PyCharm built-in browser. This server is always running and does not require any manual configuration. Learn more from Debug an application that is running on the built-in server.
Press Ctrl+Alt+S to open settings and then select .
In the Built-in server area, specify the port where the built-in web server runs. By default, this port is set to the default PyCharm port 63342 through which PyCharm accepts connections from services. You can set the port number to any other value starting from 1024.

Customize the default debugger configuration
Suppress calls
Open settings by pressing Ctrl+Alt+S and navigate to .
Suppress calls to the files on the built-in server from other computers or from outside PyCharm by clearing the Can accept external connections or the Allow unsigned requests checkbox respectively.

Choose the way to remove breakpoints
By default, you can toggle breakpoints by clicking the left mouse button. To change this behavior:
Open settings by pressing Ctrl+Alt+S and navigate to .
In the Remove breakpoint area, select the appropriate option.

Advanced options
Open settings by pressing Ctrl+Alt+S and navigate to .
Enable or disable Inline Debugging, specify when you want to see tooltips with object values and expressions evaluation results, and so on.

Open settings by pressing Ctrl+Alt+S and navigate to .
Specify whether you want object properties to be shown in object nodes. If so, specify the properties. Use
 and
and  to manage the list of properties.
Start a debugging session with your preferred Chrome user data
You may notice that your debugging session starts in a new window with a custom Chrome user data instead of your own, habitual, one. As a result, the window looks unusual, for example, your bookmarks, the browser history, and the extensions are missing, which altogether breaks your development experience. That happens because PyCharm uses the Chrome Debugging Protocol and runs Chrome with the --remote-debugging-port option. However, if Chrome is already started, a debugging port can't be opened for any new or existing Chrome instance that has the same user data directory. Therefore, PyCharm always starts a debugging session in a new window with a custom user data directory.
To open a new Chrome instance with your familiar look-and-feel, configure Chrome in PyCharm to start with your user data directory.
Configure Chrome in PyCharm to start with your preferred Chrome user data
Save your preferred Chrome user data on your computer in a separate custom directory different from the Chrome default user data directory.
You need to save your preferred user data in a separate custom directory because Chrome 136 and later does not support debugging in the default user directory. Learn more from the Chrome official website.
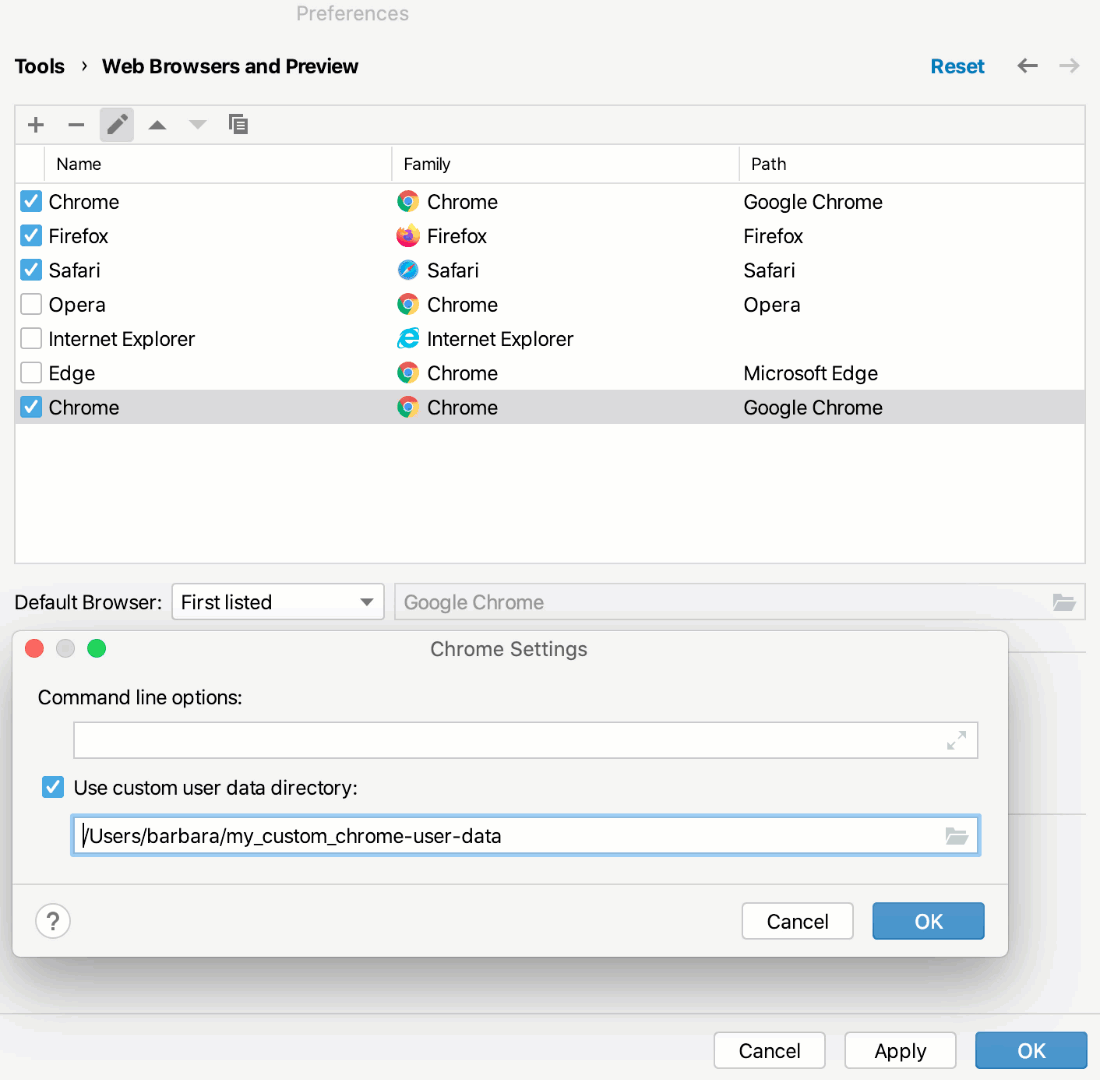
Press Ctrl+Alt+S to open settings and then select .
To create a new Chrome configuration, click
. A new item appears in the list. In the Path field, specify the path to the Chrome installation folder.Select the new configuration and click the Edit button (
 ).
).In the Chrome Settings dialog, select the Use custom user data directory checkbox and specify the path to the custom directory with your preferred user data.
If you have several user data profiles, each of them is stored in a separate subdirectory. To use a profile, specify it in the Command line options field as follows:
--profile-directory="<profile_to_use>"
Mark your Chrome browser configuration default as described in Choosing the default PyCharm browser. Do not forget to select the necessary browser from the Browser list when creating a run/debug configuration.