Run/debug configurations
PyCharm uses run/debug configurations to run, debug, and test your code. Each configuration is a named set of startup properties that define what to execute and what parameters and environment should be used.
With different startup properties, you can define different ways that PyCharm uses to execute your script. For example, you can execute the same code with different Python interpreters, providing various sets of environment variables, and getting input values from alternative files.
There are two types of run/debug configurations:
Temporary — created every time you run or debug functions or tests.
Permanent — created explicitly from a template or by saving a temporary configuration. Permanent configurations remain as part of your project until you remove them.
Whenever you run, debug, or test your code, PyCharm either uses an existing permanent run/debug configuration or creates a new temporary one.
Permanent configurations have opaque icons while the icons of temporary configurations are semi-transparent. The red cross over the configuration icon indicates an error in configuration settings.
The maximum number of temporary configurations is 5. The older ones are automatically deleted when new ones are added. If necessary, you can increase this limit in .
Create permanent run/debug configurations
PyCharm provides the following ways to create a permanent run/debug configuration:
Create from a template or copy an existing configuration.
Save a temporary configuration as permanent
Select a temporary configuration in the run/debug configuration switcher, click
/
and select Save Configuration.
Once you save a temporary configuration, it becomes permanent and it is recorded in a separate XML file in the <project directory>/.idea/ directory. For example, MyProject/.idea/Car.xml.
Alternatively, select a temporary configuration in the Run/debug configurations dialog and click
on the toolbar.
PyCharm provides run/debug configuration templates for different languages, tools, and frameworks. The list of available templates varies depending on the installed and enabled plugins.
Create a run/debug configuration from a template
Go to . Alternatively, click
in the Run widget and select Edit Configurations from the drop-down menu.
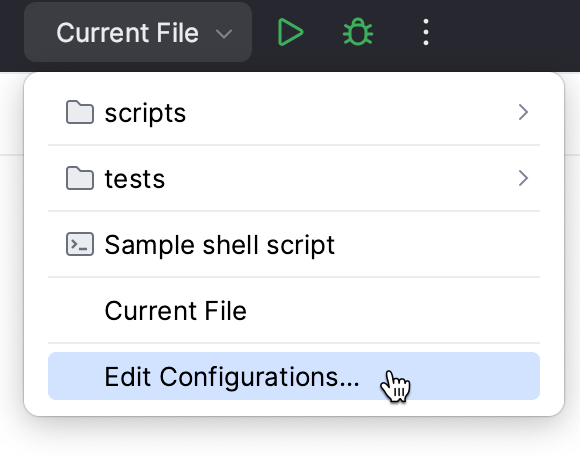
In the Run/Debug Configurations dialog, click
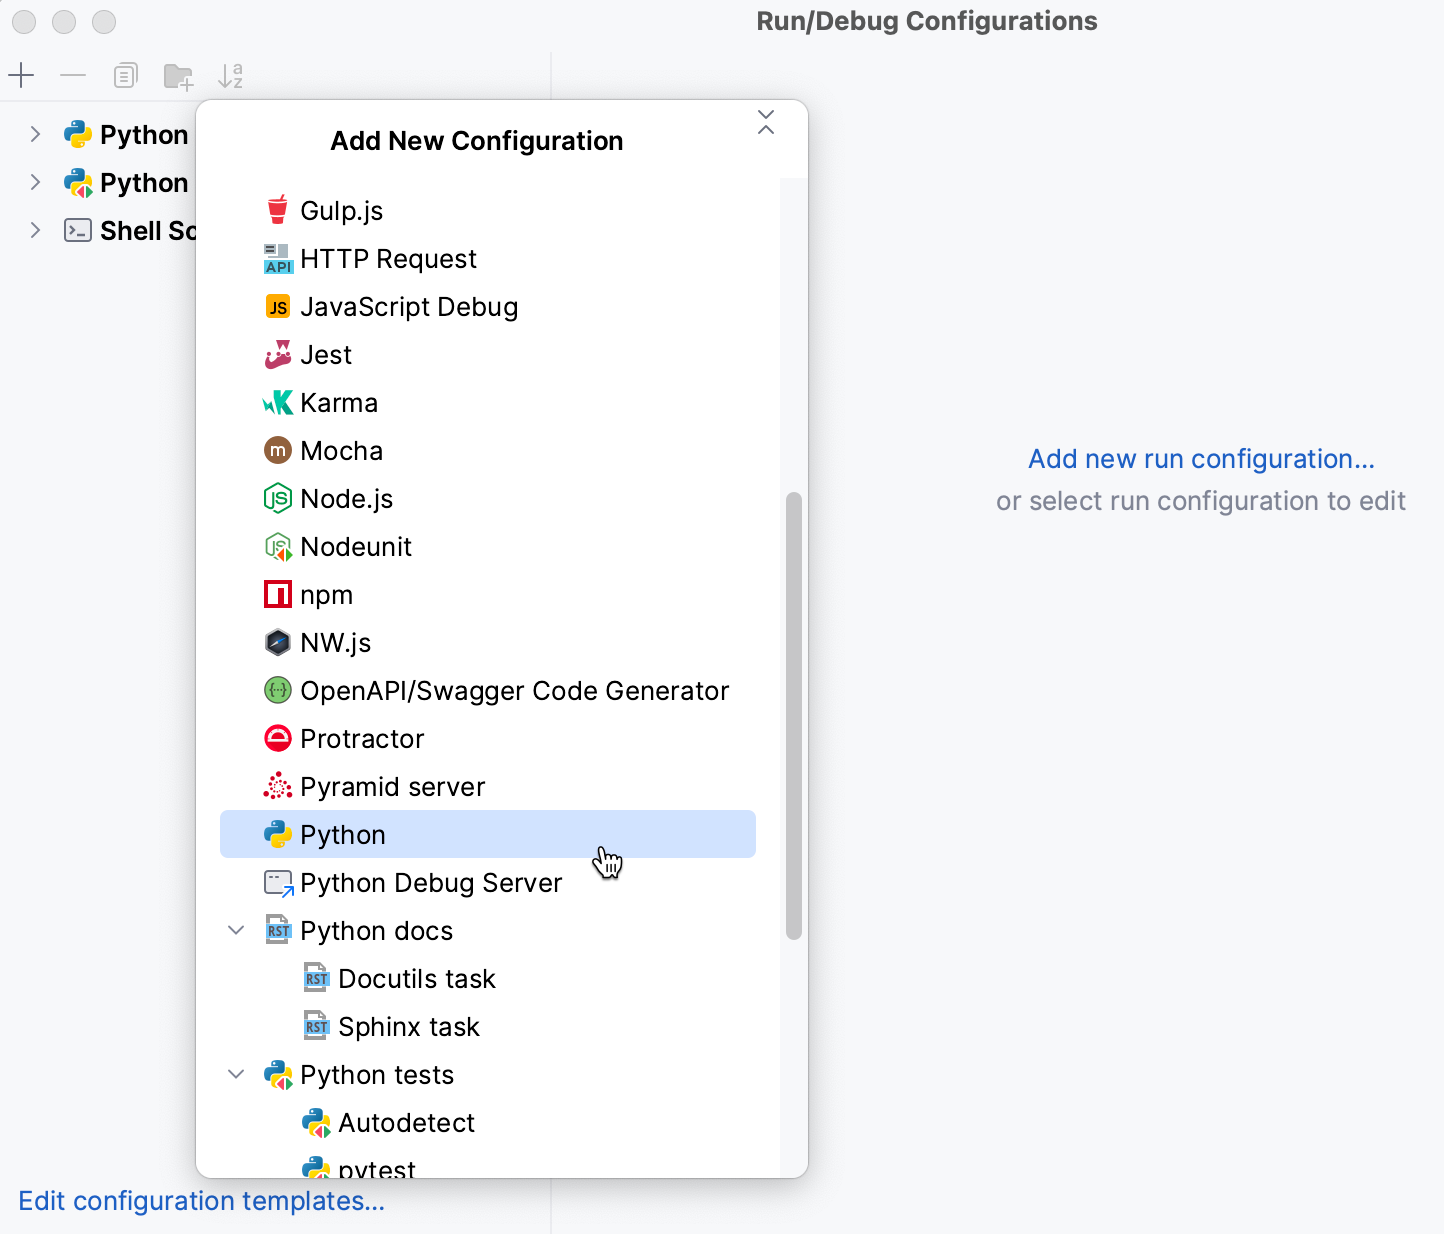
on the toolbar or press Alt+Insert. The list shows the run/debug configuration templates. Select Python.
Specify the run/debug configuration name in the Name field. This name will be used to identify the run/debug configuration in lists and menus.
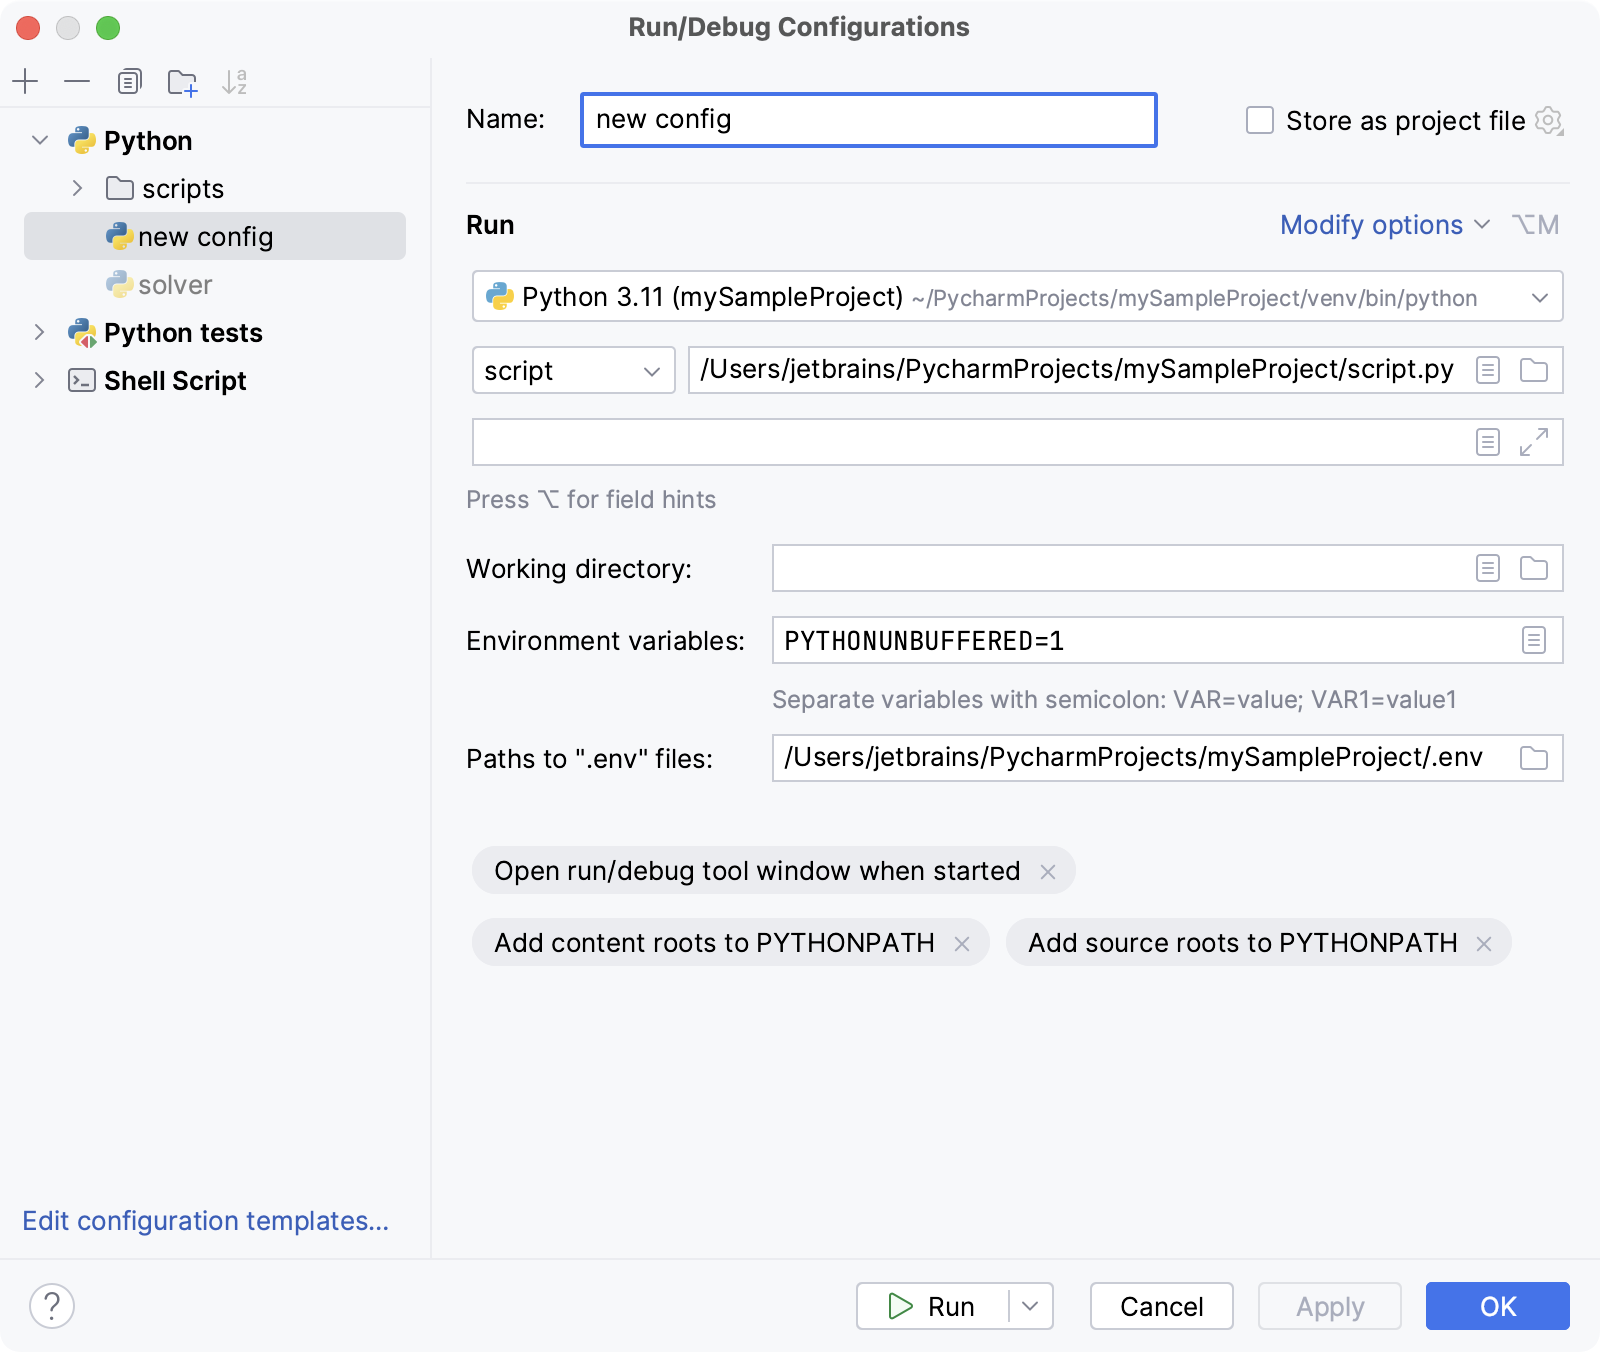
Configure the run/debug configuration parameters. The list of mandatory and optional parameters may vary depending on the selected run/debug configuration type.
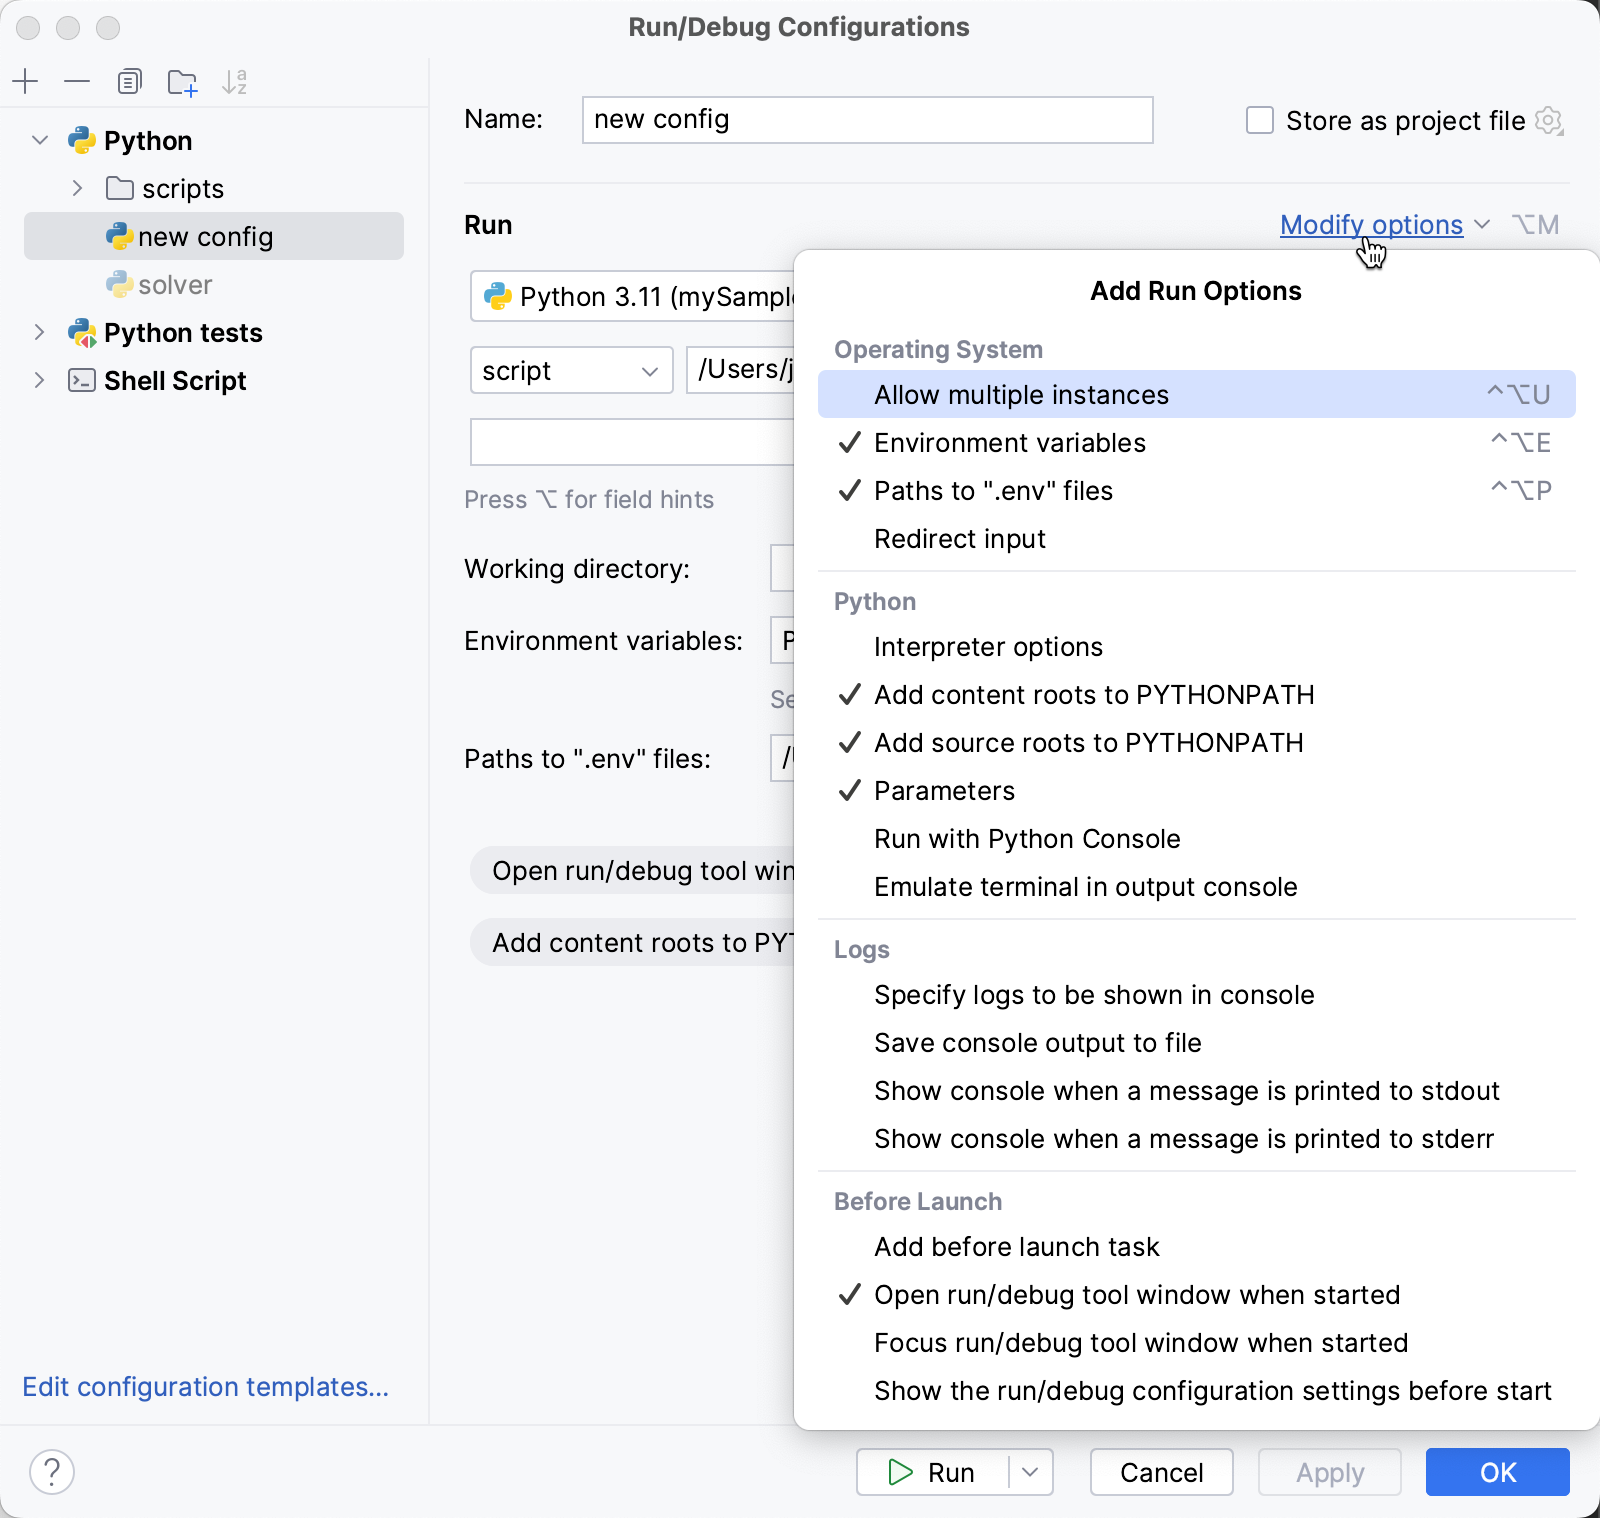
Some optional parameters are hidden. To view and enable them, click the Modify options link.
For the detailed description of the Python template, see Run/Debug configuration parameters.
You can either run the configuration right away or save the configuration to run it later.
To save the run configuration for later, click OK.
To run the configuration right away, click Run.
To delete a configuration, do one of the following:
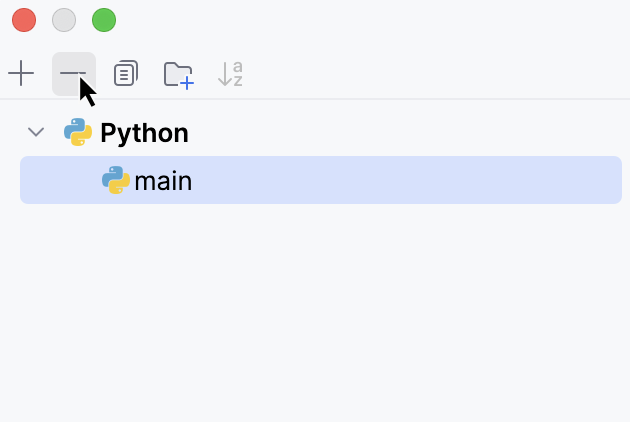
In the Run/Debug Configurations dialog, select the configuration and click
Remove Configuration on the window toolbar.
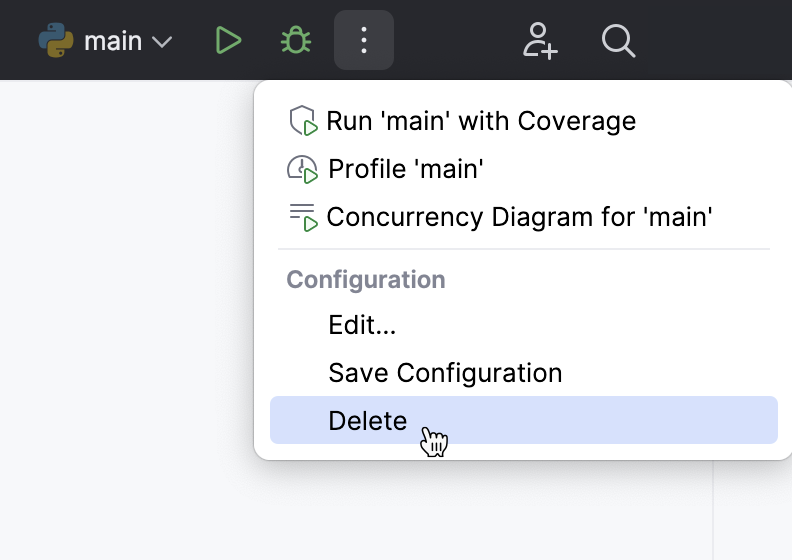
Select the configuration from the list of Run/Debug configurations and click
More Actions on the main toolbar. Select Delete from the menu.
Before launch
In this area, you can specify tasks to be performed before starting the selected run/debug configuration. The tasks are performed in the order they appear in the list.
Item | Shortcut | Description |
|---|---|---|
Alt+Insert | Click this icon to add one of the following available tasks:
| |
Alt+Delete | Click this icon to remove the selected task from the list. | |
Enter | Click this icon to edit the selected task. Make the necessary changes in the dialog that opens. | |
Alt+Up Alt+Down | Click these icons to move the selected task one line up or down in the list. The tasks are performed in the order that they appear in the list. | |
Show this page | Select this checkbox to show the run/debug configuration settings prior to actually starting the run/debug configuration. | |
Activate tool window | By default this checkbox is selected and the Run or the Debug tool window opens when you start the run/debug configuration. Otherwise, if the checkbox is cleared, the tool window is hidden. However, when the configuration is running, you can open the corresponding tool window for it yourself by pressing Alt+4 or Alt+5. |
Add a macro to a Python run/debug configuration
Go to . Alternatively, click
in the Run widget and select Edit Configurations from the drop-down menu.

In the Run/Debug Configurations dialog, select the target configuration from the list of the Python run/debug configurations.
Click
Insert Macros in one of the following fields:
Script path
Parameters
Working directory
Select a macro from the list of the available macros.
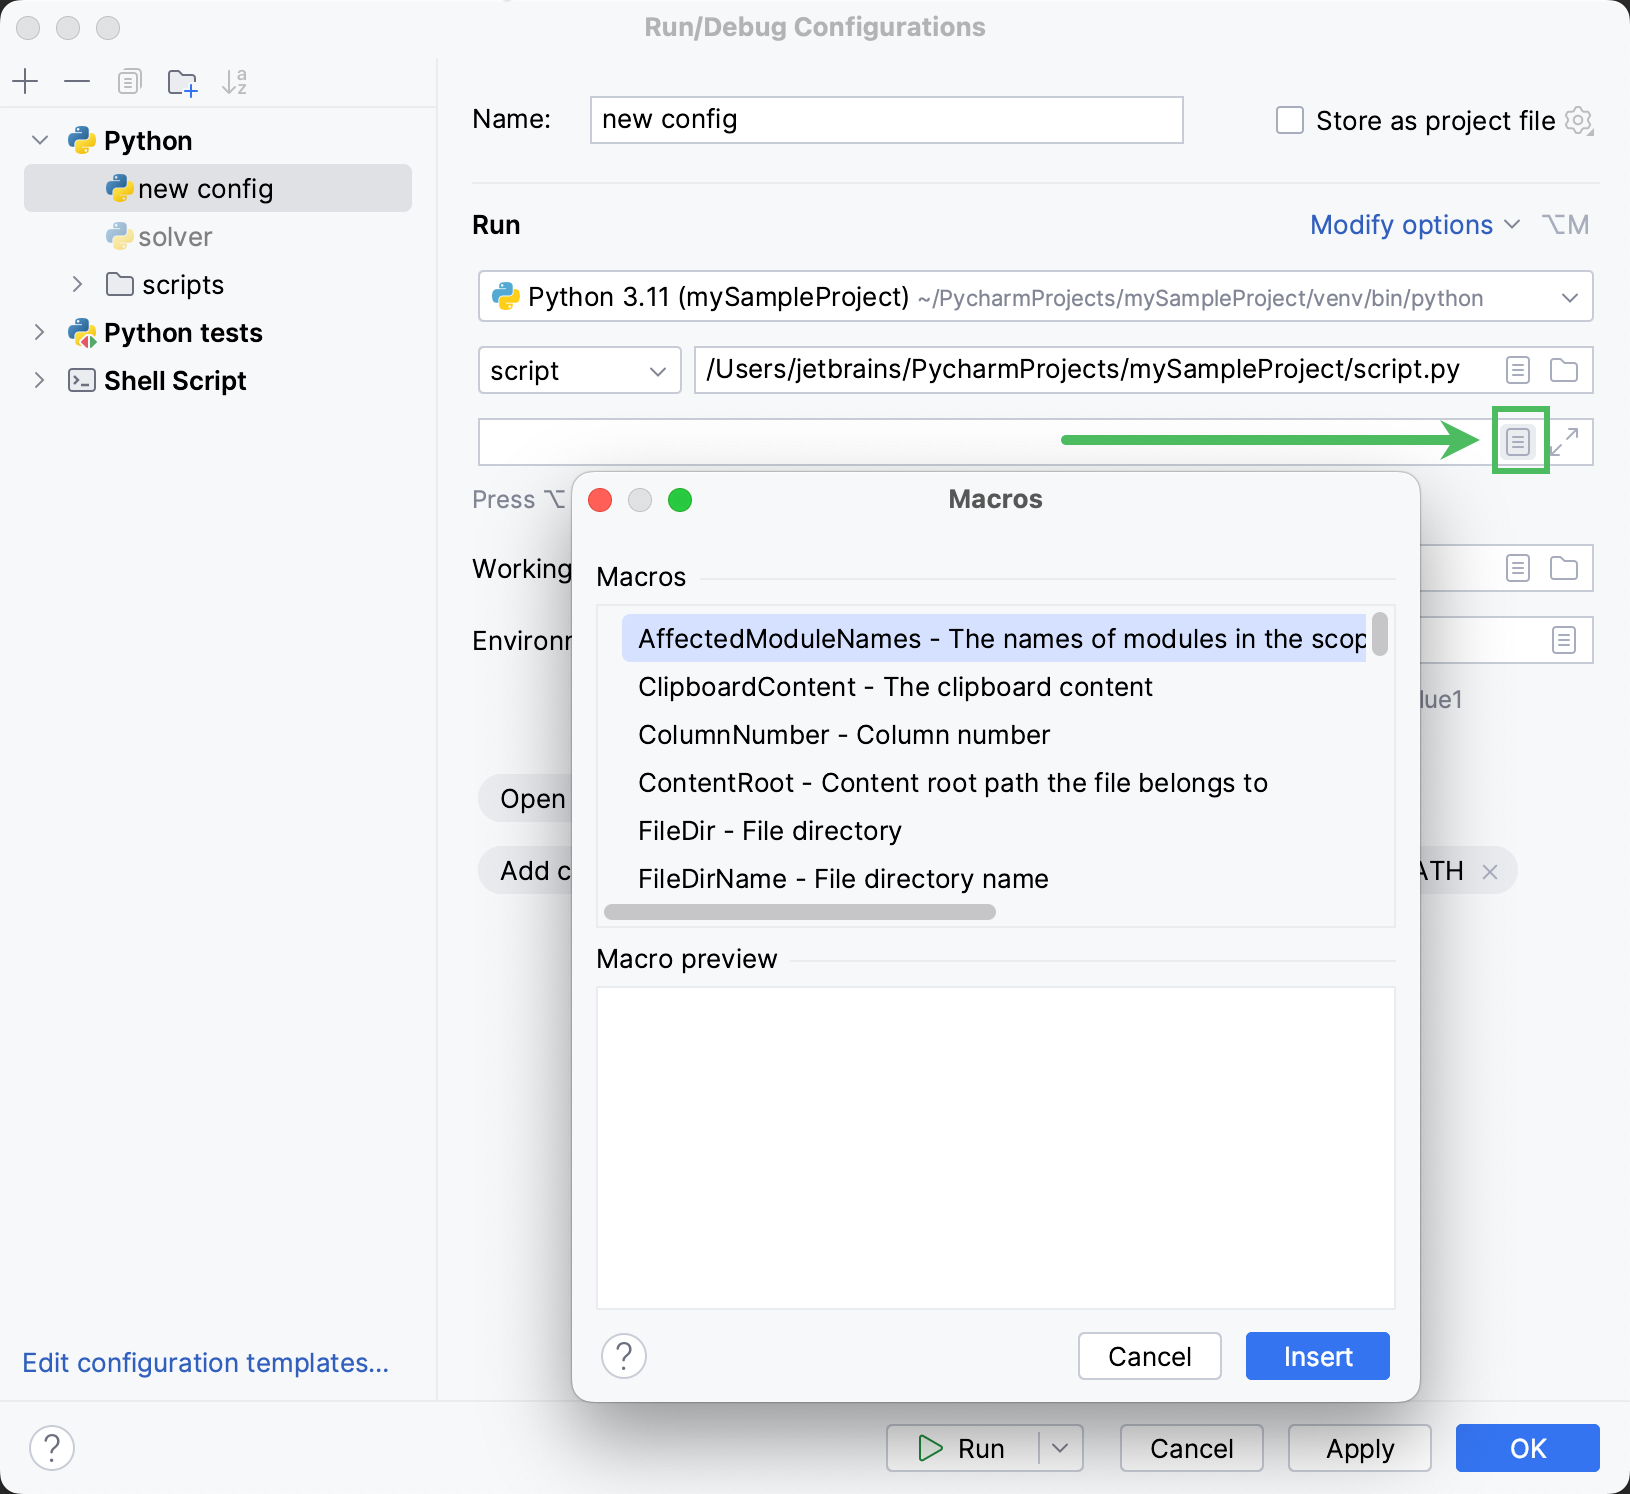
Click Insert to add the selected macro.
See Pass parameters to the running script for an example of using a macro in a run/debug configuration.
Launch a run configuration
You can launch existing run configurations in one of the following ways:
If the run configuration is already selected in the Run widget, click
next to it or press Shift+F10.

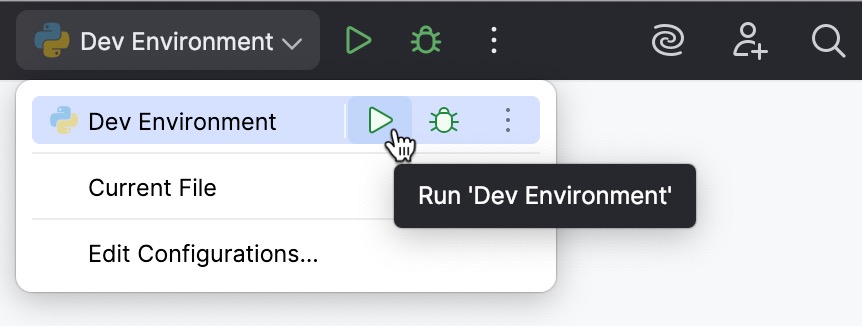
If you want to select another run configuration, click the Run widget. In the menu that opens, click
next to the run configuration you want to launch.
Press Alt+Shift+F10. In the menu that opens, click the run configuration you want to launch.
Share run/debug configurations
You might want to share your run/debug configurations so that your teammates could run the application using the same configuration or enable them to remotely attach to the process you are running.
PyCharm provides a mechanism to store your run/debug configurations as project files and share them through VCS. The same mechanism can also be used when you want to send your configuration as a file to someone else, create a local backup of your run/debug configurations, or import them from a file.
Legacy .ipr-based projects do not support individual run/debug configurations. With legacy projects, you can only share all configurations at once by adding the .ipr file to the VCS.
Go to . Alternatively, click
in the Run widget and select Edit Configurations from the drop-down menu.

Select the run/debug configuration you want to share, enable the Store as project file option, and specify the location where the configuration file will be stored.
You can configure any location unless compatibility with PyCharm 2019.3 and earlier is required. For compatibility with these versions, store the file in the suggested location.
(Optional) If the .idea directory is added to VCS ignored files, the .idea/runConfigurations subfolder will be ignored, too. If the project uses Git, you can share .idea/runConfigurations and leave .idea ignored by modifying .gitignore as follows:
/.idea/* !/.idea/runConfigurations
Run/debug configuration templates
All run/debug configurations are based on templates, which implement the startup logic, define the list of parameters and their default values. The list of available templates is predefined in the installation and can only be extended via plugins. However, you can edit default parameter values in each template to facilitate the setup of new run/debug configurations.
Configure the default values for a template
Go to . Alternatively, click
in the Run widget and select Edit Configurations from the drop-down menu.

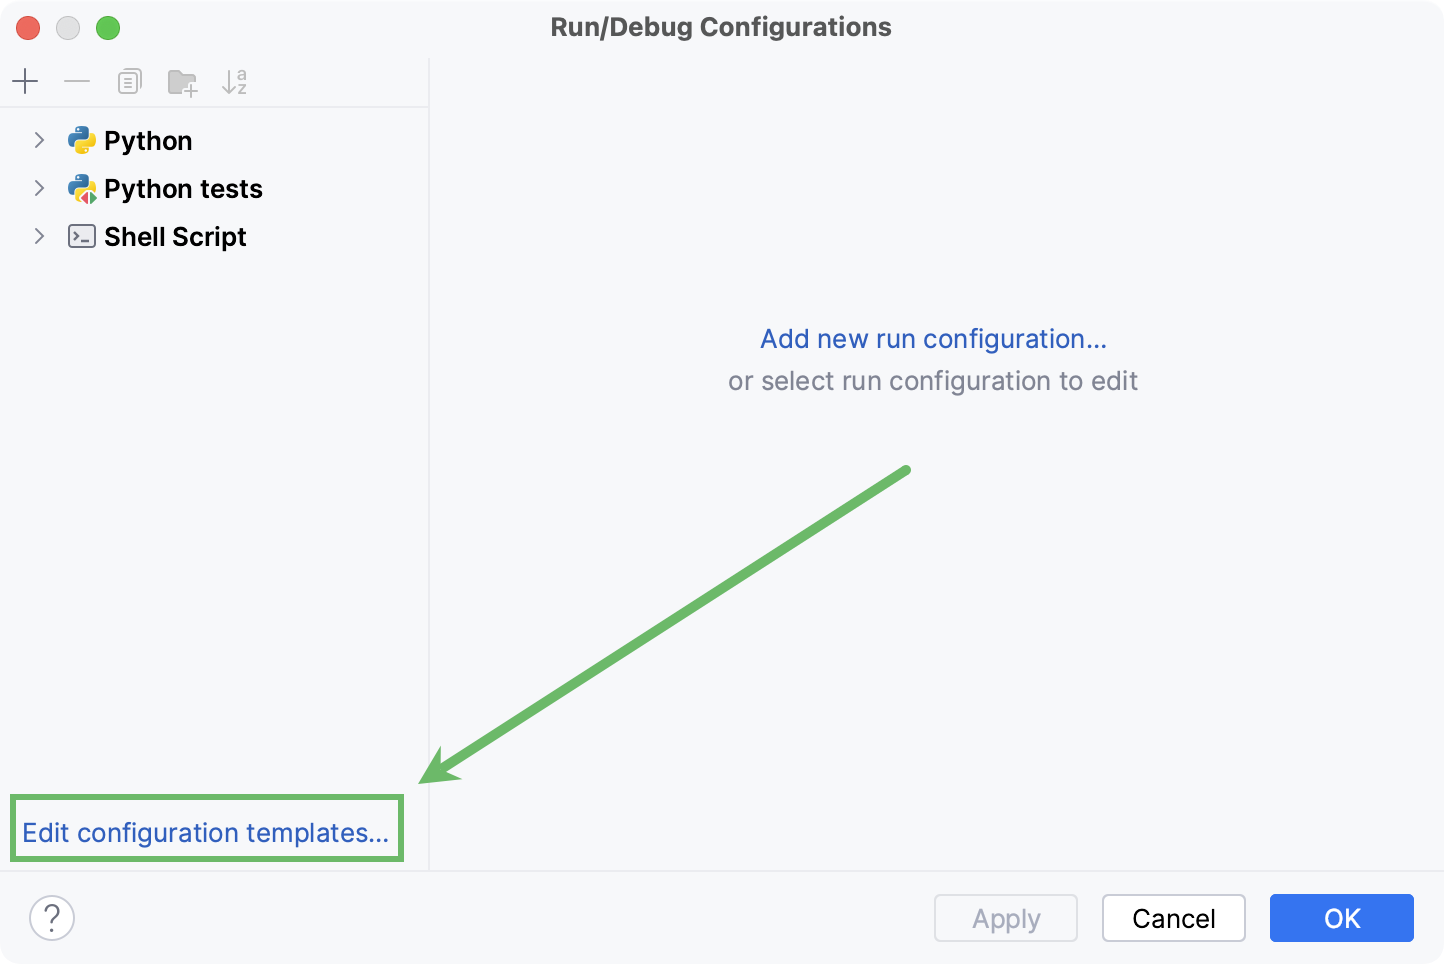
In the left-hand pane of the run/debug configuration dialog, click Edit configuration templates.
In the Run/Debug Configuration Templates dialog that opens, select a configuration type.
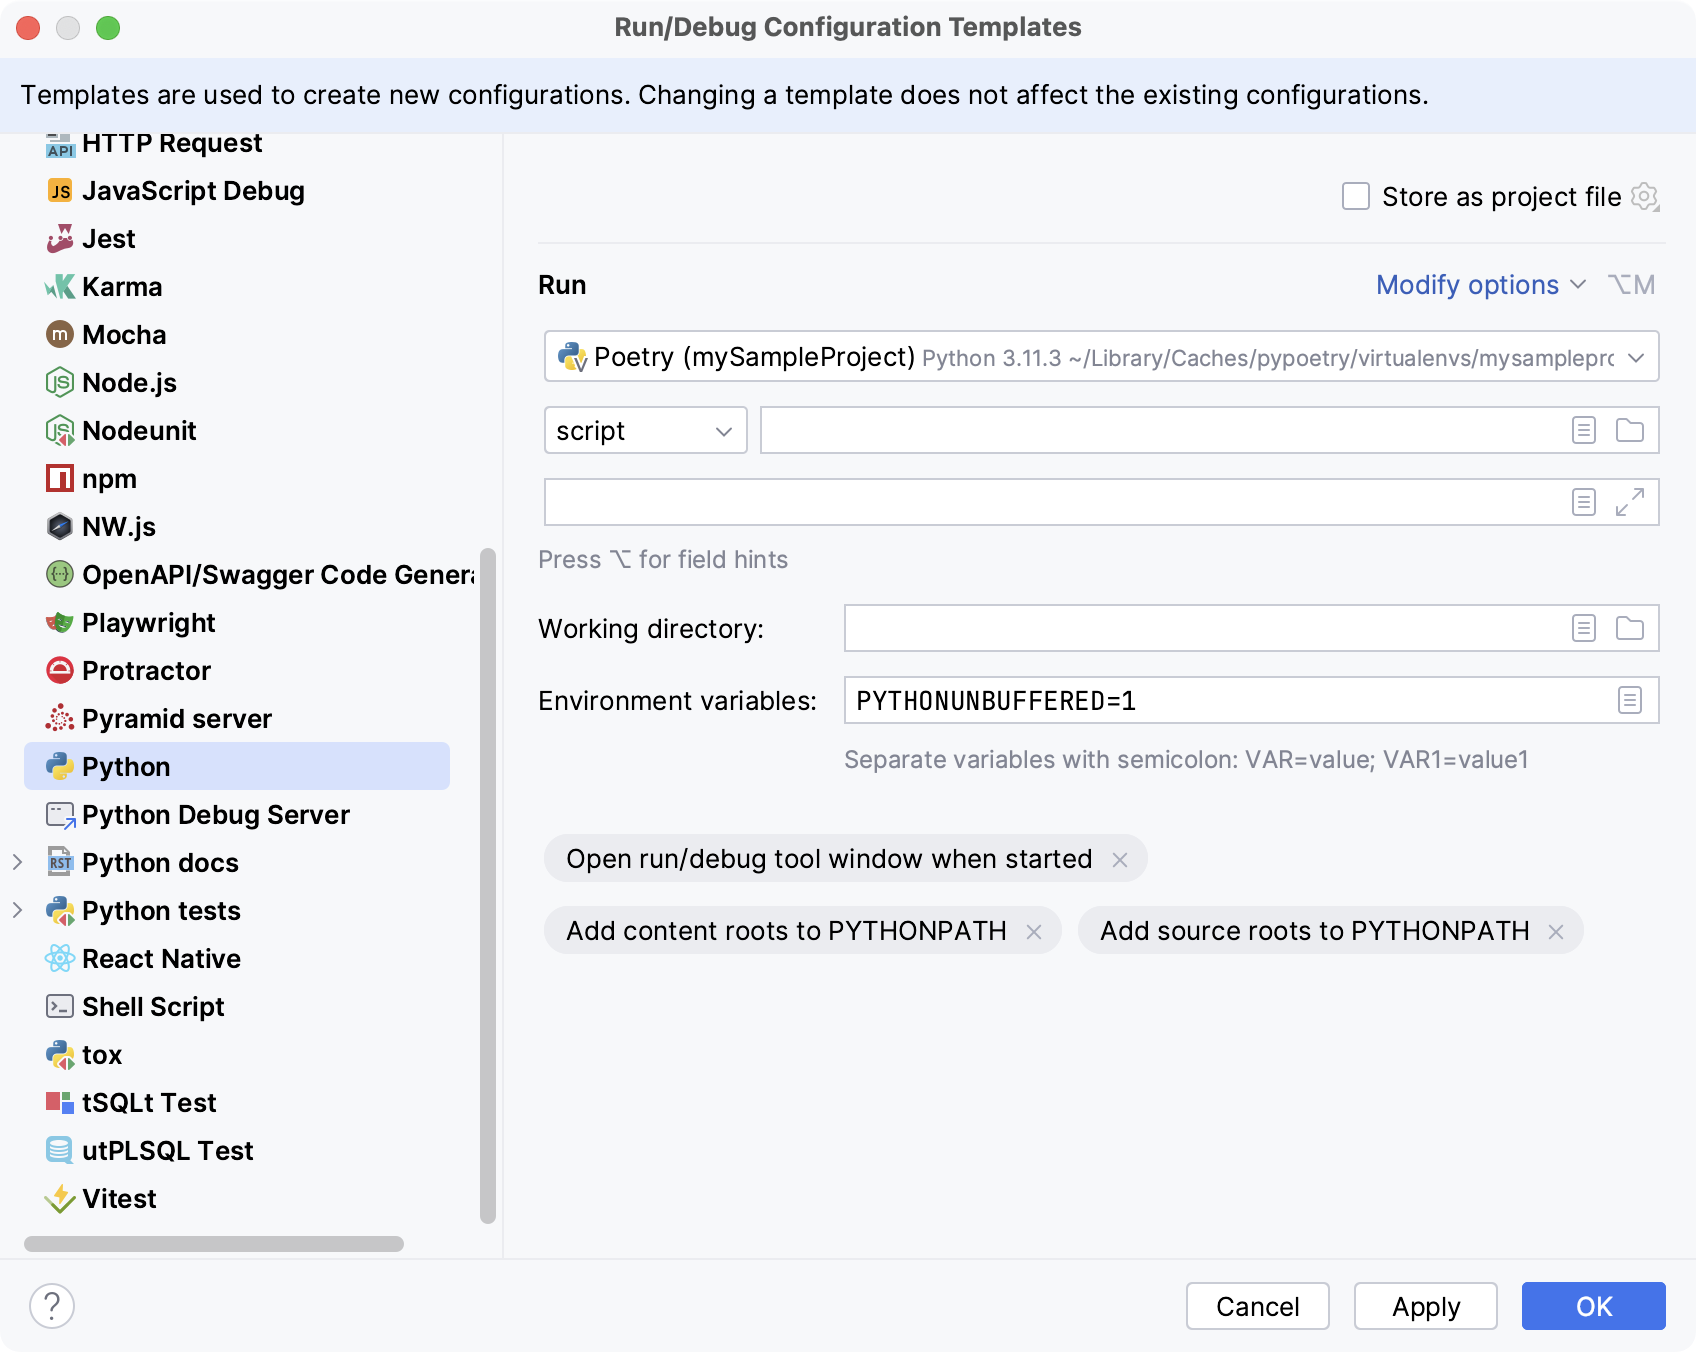
Specify the desired default parameters and click OK to save the template.
Run/debug configuration folders
When there are many run/debug configurations of the same type, you can group them in folders for easier access.
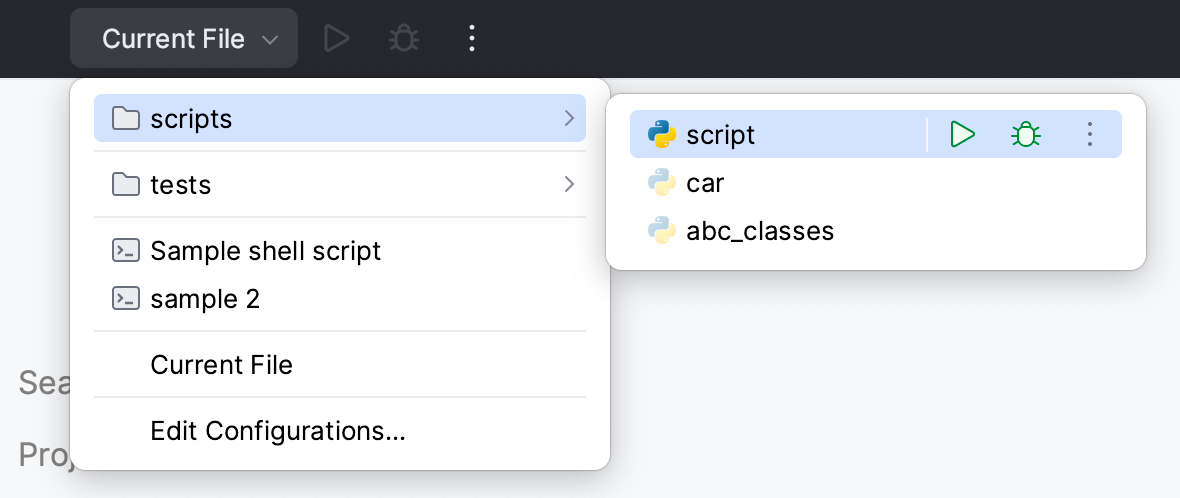
Create a folder for run/debug configurations
Go to . Alternatively, click
in the Run widget and select Edit Configurations from the drop-down menu.

In the Run/Debug Configurations dialog, select a configuration type and click
on the toolbar. A new empty folder for the selected type is created.
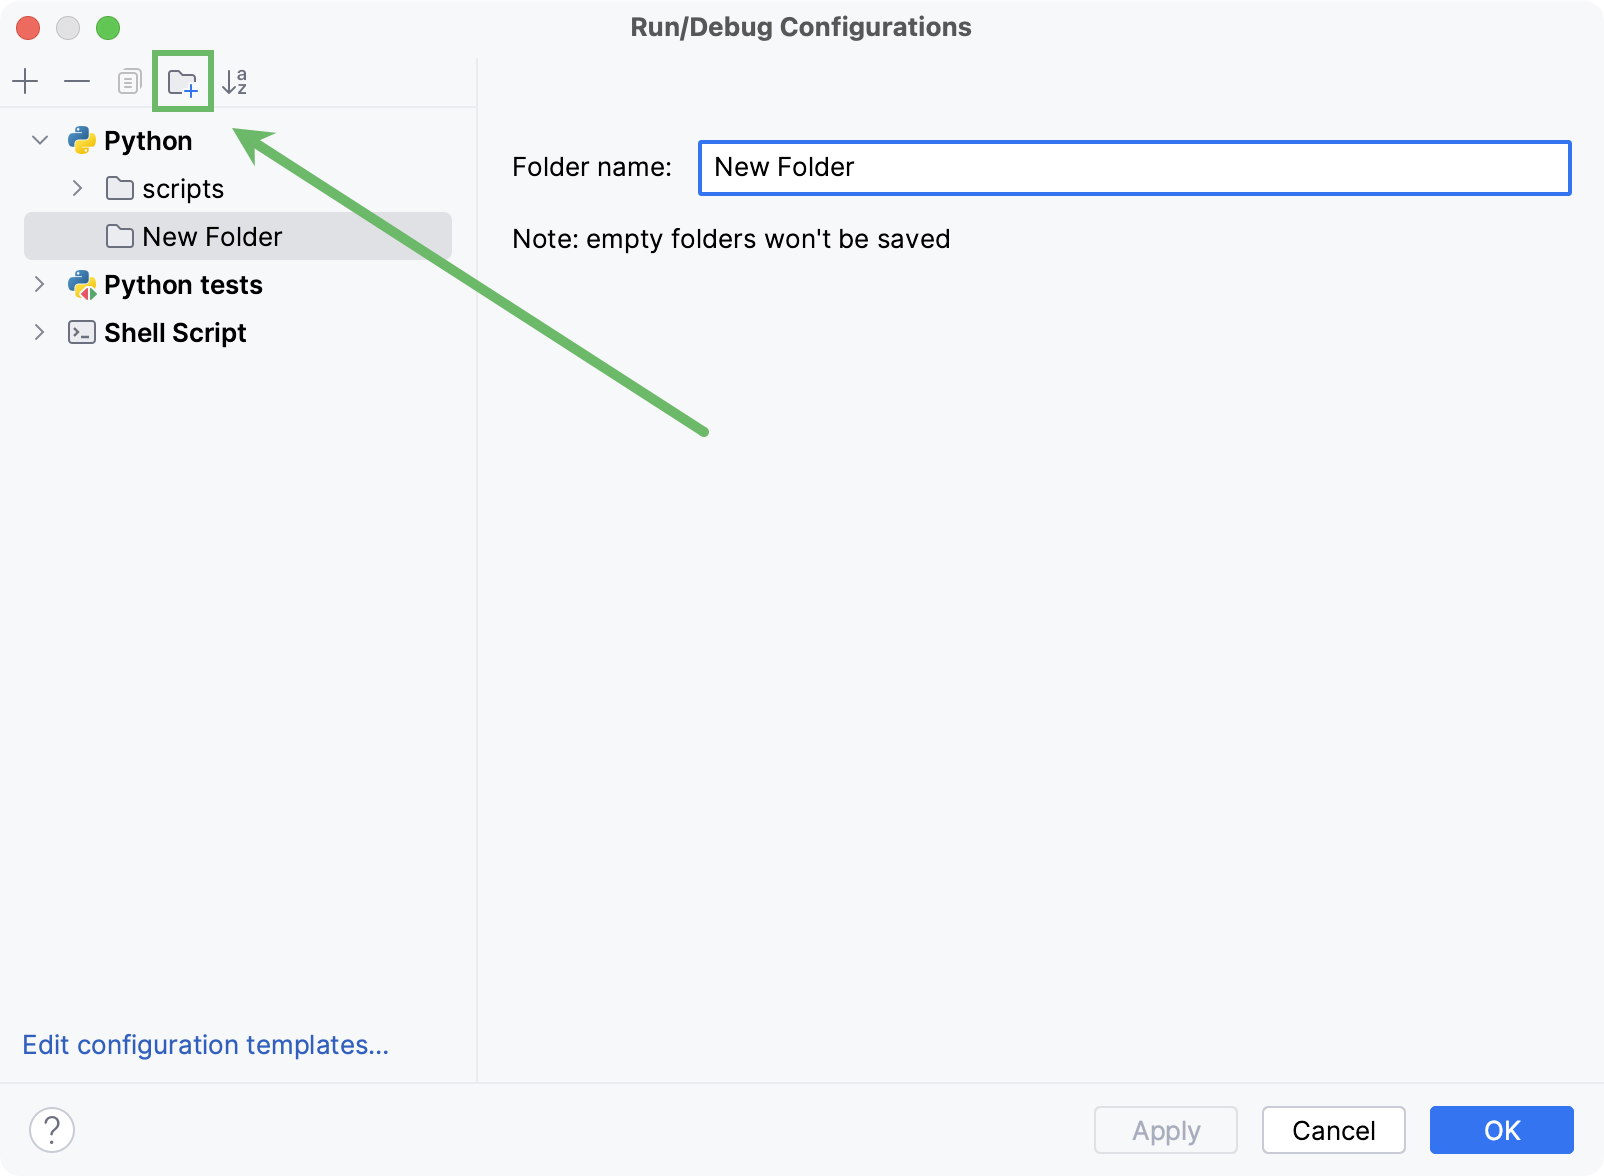
Specify the folder name in the text field to the right or accept the default name.
Select the desired run/debug configurations and move them under the target folder.
Apply the changes. If a folder is empty, it will not be saved.
When you no longer need a folder, you can delete it Delete. The run/debug configurations grouped under this folder will be moved under the root of the corresponding run/debug configuration type.
Run/Debug configurations in the Services tool window
You can manage multiple run/debug configurations in the Services tool window. For example, you can start, pause, and stop several applications, track their status, and examine application-specific details.
Add Run/Debug configurations to the Services window
Select from the main menu or press Alt+8.
In the Services tool window, click Add service, then select Run Configuration Type.
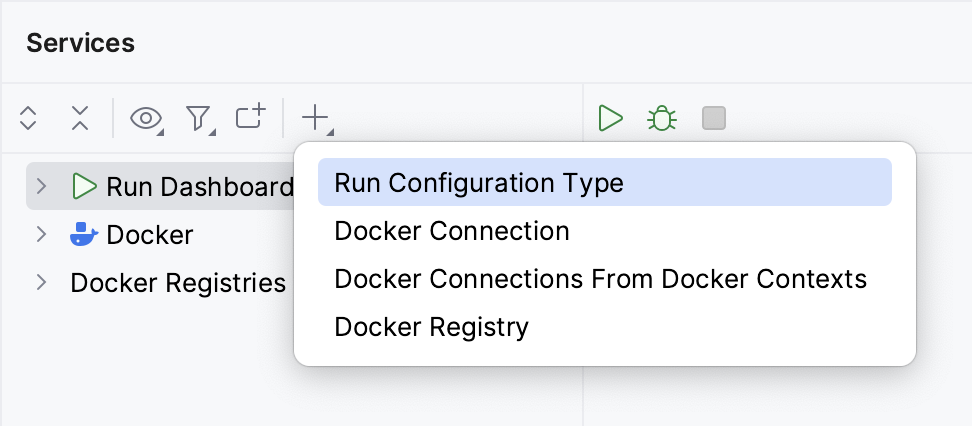
Select a run/debug configuration type from the list to add all configurations of this type to the window.
Note that the tool window will only display the configuration types for which you have created one or more configurations.
Run/Debug configuration parameters
Item | Description | ||||||||
|---|---|---|---|---|---|---|---|---|---|
Script path/Module name | Click the list to select a type of target to run. Then, in the corresponding field, specify the path to the Python script or the module name to be executed. You can use path variables in this field. | ||||||||
Parameters | In this field, specify parameters to be passed to the Python script. When specifying the script parameters, follow these rules:
In this field you can add a macros to pass various project- or context-specific values when running a run/debug configuration. Click + and select one of the available macros from the list. See Adding macros to run/debug configuration for more details. | ||||||||
Allow multiple instances | Select this option if you want to allow multiple instances of the configuration to run at the same time. If this option is disabled, attempting to re-run the configuration will terminate the active session. | ||||||||
Environment | |||||||||
Project | Click this list to select one of the projects, opened in the same PyCharm window, where this run/debug configuration should be used. If there is only one open project, this field is not displayed. | ||||||||
Environment variables | This field shows the list of environment variables. If the list contains several variables, they are delimited with semicolons. By default, the field contains the variable To create a new variable, click You might want to populate the list with the variables stored as a series of records in a text file, for example:
Variable1 = Value1
Variable2 = Value2
Just copy the list of variables from the text file and click Paste ( | ||||||||
Paths to ".env" files | This field shows paths to .env files with environment variables. If there are several files, the paths to them are delimited with semicolons. To manage the list of .env files, click You can also use | ||||||||
Python Interpreter | Select one of the pre-configured Python interpreters from the list. | ||||||||
Interpreter options | In this field, specify the command-line options to be passed to the interpreter. If necessary, click | ||||||||
Working directory | Specify a directory to be used by the running task.
You can use path variables in this field. | ||||||||
Add content roots to PYTHONPATH | Select this checkbox to add all content roots of your project to the environment variable PYTHONPATH; | ||||||||
Add source roots to PYTHONPATH | Select this checkbox to add all source roots of your project to the environment variable PYTHONPATH; | ||||||||
Execution | |||||||||
Run with 'uv run' | Enables running your script or module with uv. This checkbox is selected by default for projects managed by | ||||||||
Emulate terminal in output console | Enables running your script or module in the output console with the emulated terminal mode. This mode can be helpful for the tasks that cannot be implemented with the standard output console, for example, when your script performs caret return actions ( | ||||||||
Run with Python console | Enables running your script or module with the Python console. | ||||||||
Redirect input from | Enables redirecting data from a text file to standard input. Use this option if your script requires some input and you want to automatically submit the values instead of typing them in the Run console. To enable redirecting, select the checkbox and specify the path to the target text file. | ||||||||
Docker container settings Click | |||||||||
Options |
Click | ||||||||
Docker Compose | |||||||||
Commands and options | You can use the following commands of the Docker Compose Command-Line Interface:
| ||||||||
Command preview | Use this field to preview the complete command string. For example, the
docker compose
-f C:\PyCharm-2019.2\Demos\djangodocker-master\docker-compose.yml
<override configuration file>
up --build exec --user jetbrains
| ||||||||