Monitor and manage tests
Test progress and results are displayed in the dedicated test runner tabs of the Run tool window.

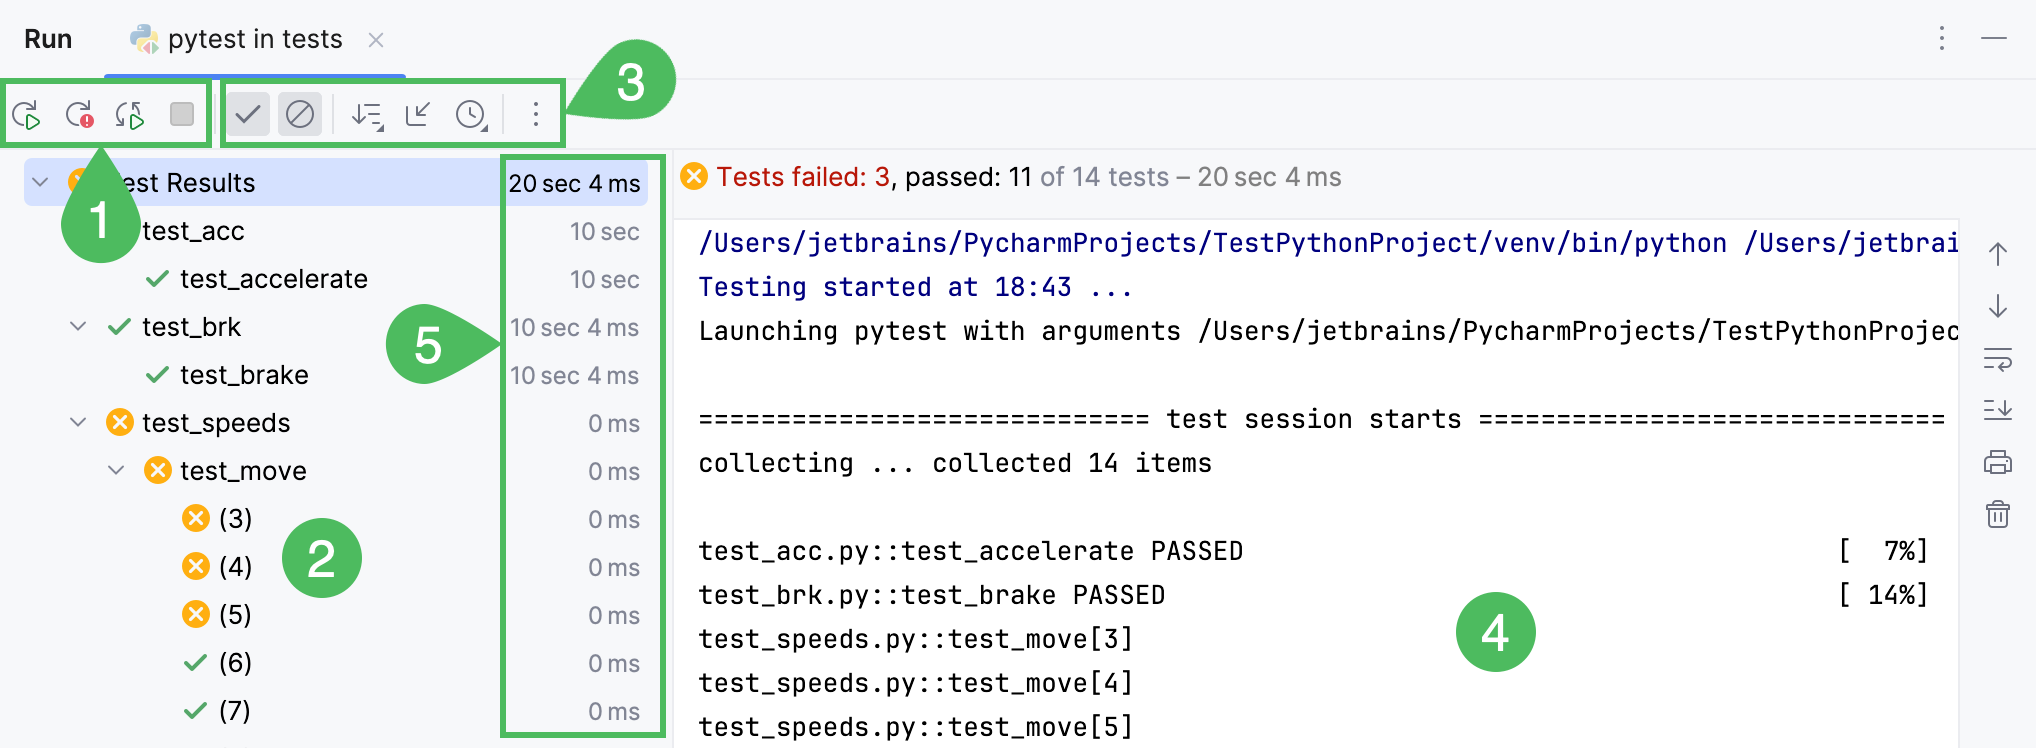
where:
The run toolbar is almost the same as that for the Run tool window, but features testing-specific buttons.
The left-hand pane shows the tree view of all tests within the current run/debug configuration.
The root node represents the test selected to run.
The nested nodes represent the hierarchy of test suites and test cases.
The leaf nodes represent the individual tests.
The status of each test is indicated by an icon. Double-click a node to open the respective test class or test method in the editor.
The testing toolbar provides controls that enable you to monitor the tests and analyze results. Some of the commands are duplicated on the context menus of the test tree nodes.
The output pane shows the output of the current test suit.
The inline statistics show the list of executed tests with the execution time of each test.
You can rerun, terminate, and suspend execution of tests same way as you do it for running applications. In addition to the common running actions, in the test runner you can:
Navigate through the list of test cases using arrow keys.
View the total number of tests being run in the current session.
Automatically restart tests in the current run configuration right after you change the source code by enabling the
Rerun Automatically option.
Rerun a failed test by clicking
. If you press Shift and click this icon, you can choose whether you want to Run the necessary test again, or Debug it.
Click
Sorting Options to show test suites always on top, sort tests alphabetically or by duration.
Show or hide information about the passed tests by clicking
Show Passed.
Show the ignored tests in the tree view of all tests within the current run/debug configuration or test class by clicking
Show Ignored.
Open the list of internally saved results of test sessions by clicking
Test History.
Load previously exported test results from a file by clicking
Import Tests from File.
Navigate from the stack trace to the problem location in the source code by clicking the hyperlink in the Output pane.