Multiprocess debugging
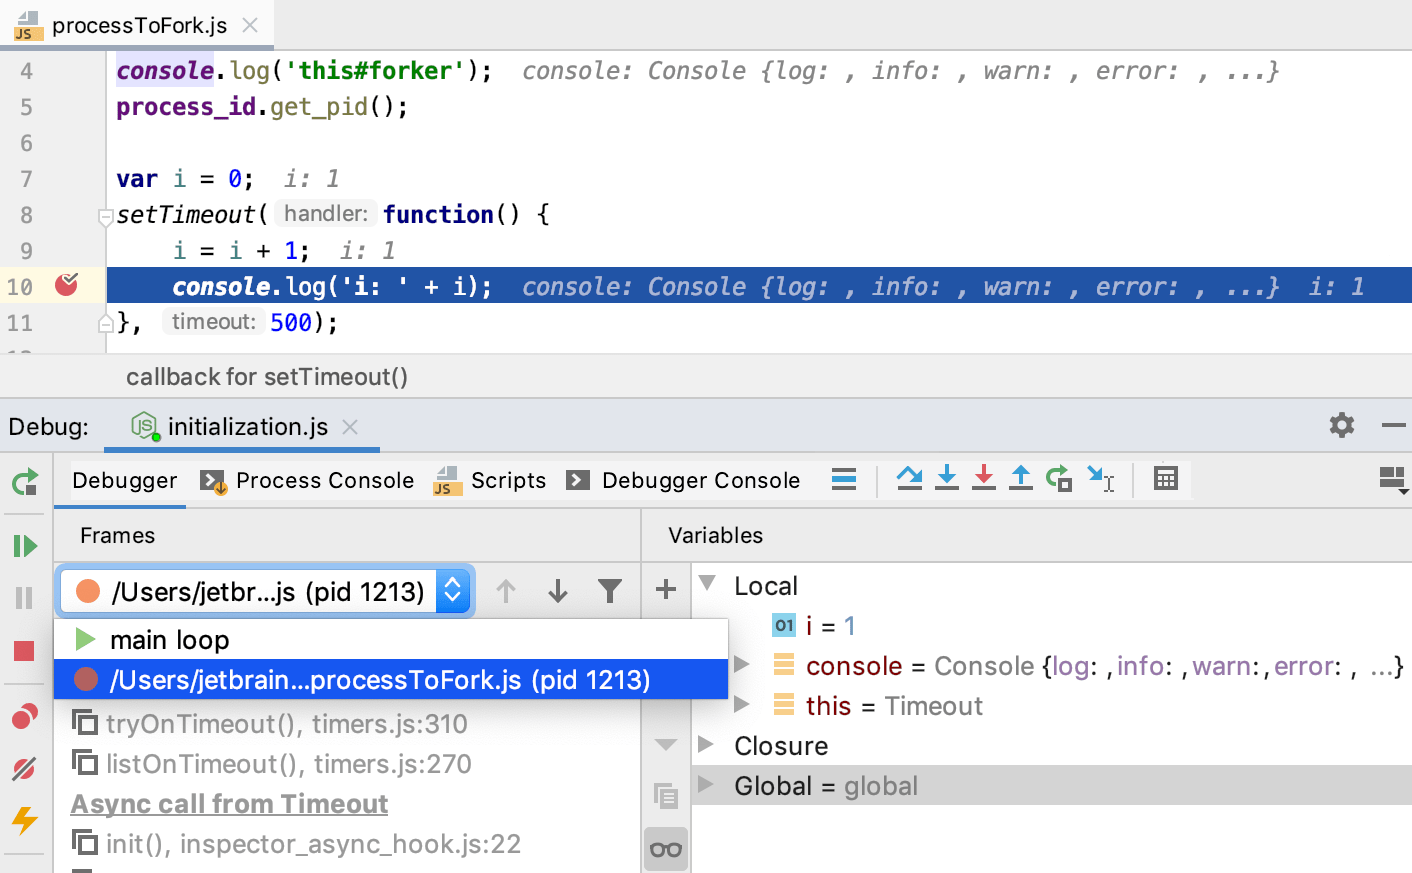
With PyCharm, you can debug additional Node.js processes that are launched by the child_process.fork() method or by the cluster module. Such processes are shown as threads in the Frames pane on the Debugger tab of the Debug tool window.

Set the breakpoints in the processes to debug.
Create a Node.js run/debug configuration as described in Running and Debugging Node.js.
From the Run widget list on the toolbar, select the newly created configuration and click
next to it.
The Debug tool window opens and the Frames list shows the additional processes as threads as soon as they are launched.
To examine the data (variables, watches, and so on) for a process, select its thread in the list and view its data in the Variables and Watches panes. When you select another process, the contents of the panes are updated accordingly.