Karma
Before you start
Make sure you have Node.js on your computer.
Make sure the JavaScript and TypeScript and Karma required plugins are enabled on the Settings | Plugins page, tab Installed. For more information, refer to Managing plugins.
Install Karma
Besides Karma itself, you need additional packages (plugins), for example karma-jasmine or jasmine-core. Learn more from the Karma official website.
Open the embedded Terminal (Alt+F12) .
Type one of the following commands:
npm installif Karma and all the required plugins are already defined in package.json.To install Karma and plugins as development dependencies:
npm install --save-dev karma npm install --save-dev <karma_plugin> <another_karma_plugin>
Generate a Karma configuration file
Karma tests are run according to a karma.conf.js configuration file which is generated in the interactive mode. If you already have karma.conf.js in your project, just skip this step. For more information about Karma configuration, refer to Karma official website.
Create a Karma configuration file
Open the Terminal and start the karma.conf.js generation wizard by typing one of the following depending on your operating system:
For macOS and Linux: ./node_modules/karma/bin/karma init
For Windows:
npm install -g karma-cli karma init
Answering the questions of the wizard, specify the testing framework to use and the browsers to be captured automatically.
See also Karma Files: Pattern matching.
Run tests
With PyCharm, you can quickly run a single Karma test right from the editor or create a run/debug configuration to execute some or all of your tests.
Run a single test from the editor
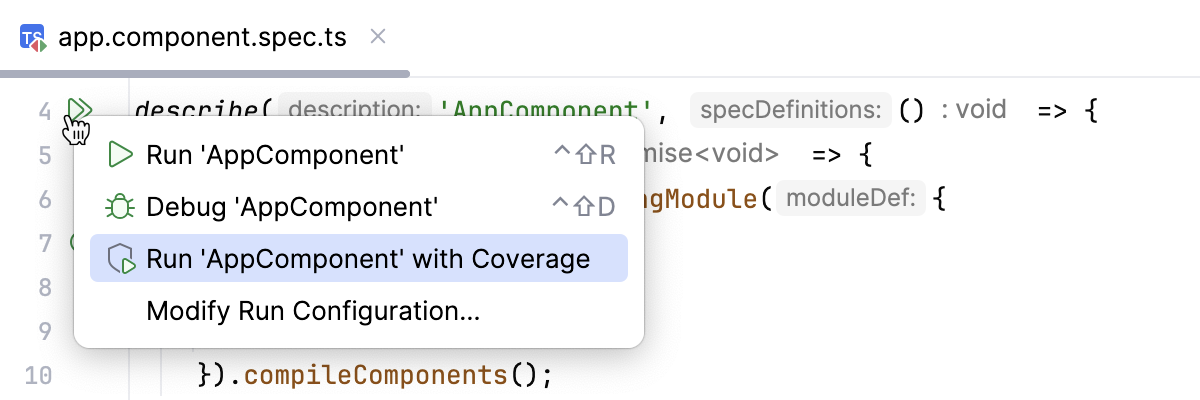
Click
or
in the left gutter and select Run <test_name> from the list.
You can also see whether a test has passed or failed right in the editor, thanks to the test status icons
and
in the gutter.
Create a Karma run configuration
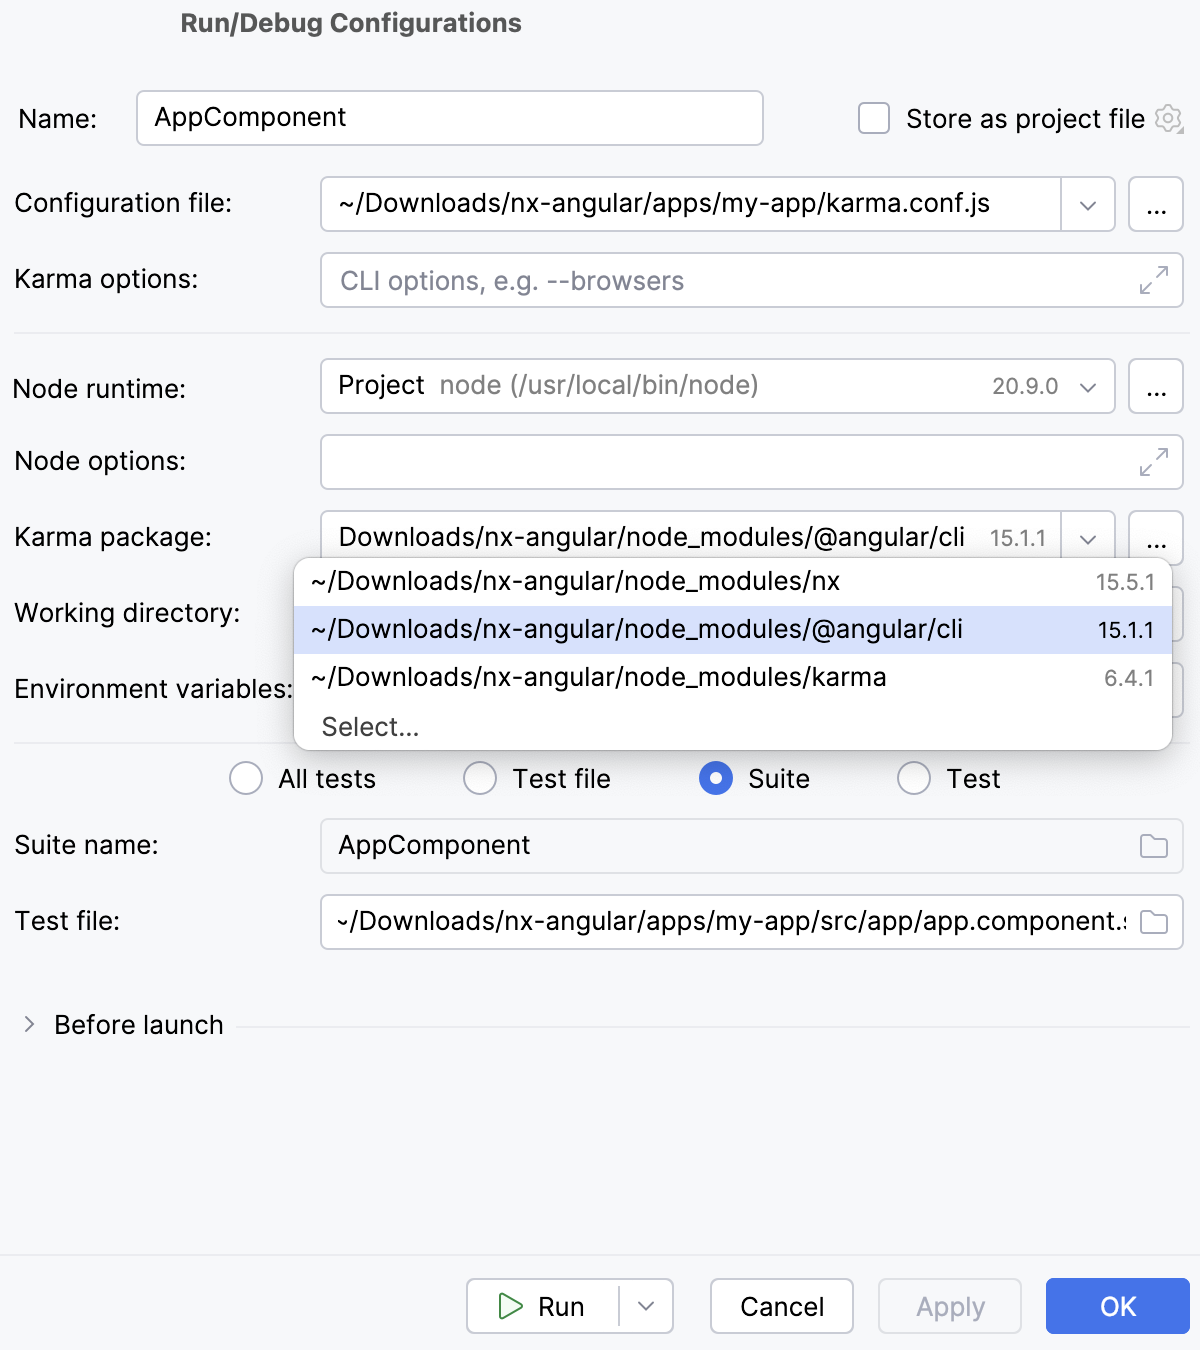
Open the Run/Debug Configuration dialog ( in the main menu), click
in the left-hand pane, and select Karma from the list. The Run/Debug Configuration: Karma dialog opens.
Specify the Node.js runtime to use.
If you choose the Project alias, PyCharm will automatically use the project default interpreter from the Node runtime field on the JavaScript Runtime page . In most cases, PyCharm detects the project default runtime and fills in the field itself.
You can also choose another configured local or remote interpreter or click
and configure a new one.
Optionally specify the Node.js-specific option parameters and the environment variables to be passed to Node.js.
Specify the path to karma.conf.js.
Specify the
karmapackage to use. This can be one of the following:The Karma installation home /npm/node_modules/karma. If you installed Karma regularly through the Node Package Manager, PyCharm detects the Karma installation home itself.
Path to
node_modules/@angular/cli.Path to
node_modules/nxif you are using Nx.

Specify the working directory of the application. By default, the Working directory field shows the project root folder. To change this predefined setting, specify the path to the desired folder.
Specify the tests to run. This can be a specific test or suite, an entire test file, or a folder with test files.
Optionally, specify the command-line options that you want to pass to Karma to override the default settings from the karma.conf.js configuration file.
For example, to run or debug tests in Headless Chrome, type
--browsers ChromeHeadlessin the Karma options field. For more information, refer to Automated testing with Headless Chrome.To see all the available CLI options, type
karma start --helpin the Terminal Alt+F12.
Run tests via a run configuration
Select the Karma run/debug configuration from the list of configurations and click
in the list or on the toolbar.
Monitor test execution and analyze test results in the Test Runner tab of the Run tool window. For more information, refer to Explore test results.
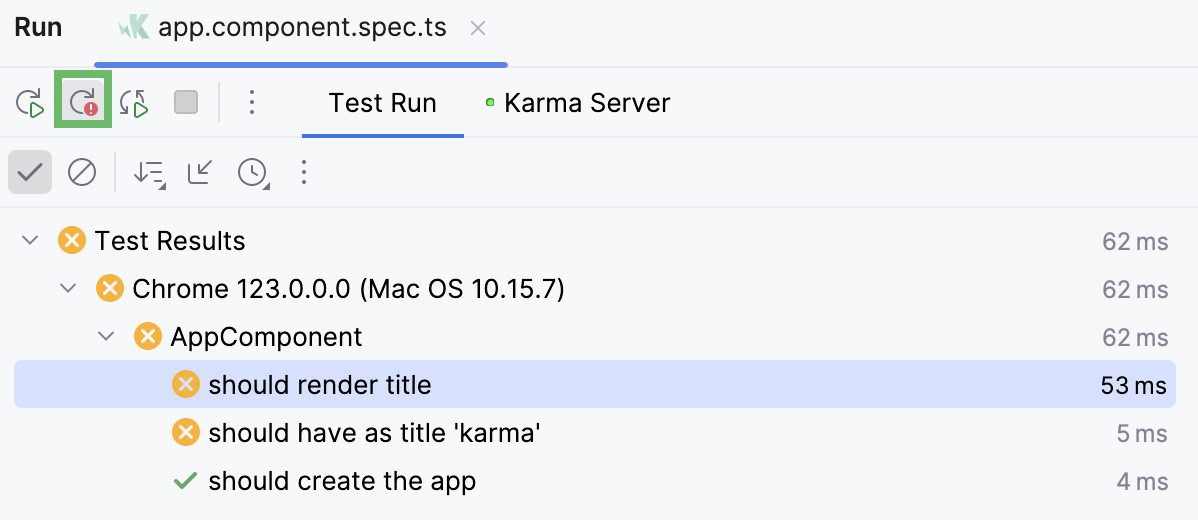
Rerun failed tests
Click
on the test results toolbar. PyCharm will execute all the tests that failed during the previous session.

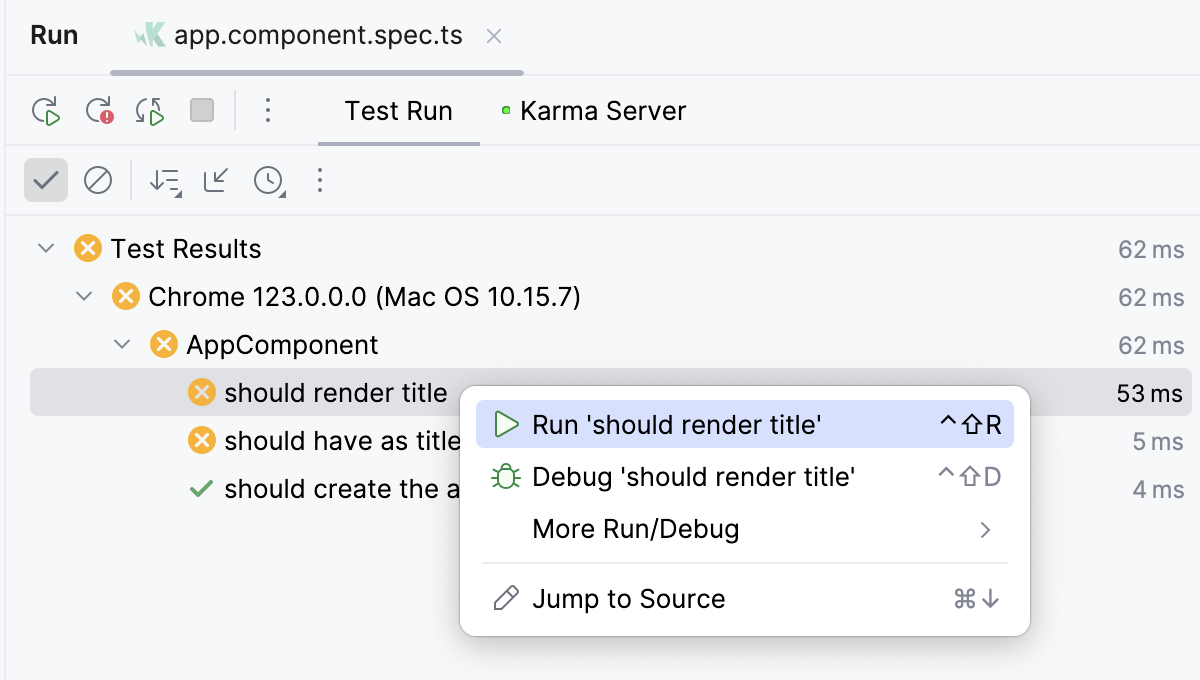
To rerun a specific failed test, select on its context menu.

To rerun all tests from the previous session, click
on the test results toolbar or press Ctrl+F5.
To rerun tests automatically after you change the related source code, press
on the test results toolbarю
For more information, refer to Rerunning tests.
Navigation
With PyCharm, you can jump between a file and the related test file or from a test result in the Test Runner Tab to the test.
To jump between a test and its subject or vice versa, open the file in the editor and select or from the context menu, or just press Ctrl+Shift+T.
To jump from a test result to the test definition, click the test name in the Test Runner tab twice, or select from the context menu, or just press F4. The test file opens in the editor with the caret placed at the test definition.
For failed tests, PyCharm brings you to the failure line in the test from the stack trace. If the exact line is not in the stack trace, you will be taken to the test definition.
Debug tests
With PyCharm, you can quickly start debugging a single Karma test right from the editor or create a run/debug configuration to debug some or all of your tests.
Start debugging a single test from the editor
Set a breakpoint inside the test.
Click
or
in the gutter and choose Debug <test_name> from the list.
Launch test debugging via a run/debug configuration
Set breakpoints where necessary.
Create a Karma run/debug configuration as described above.
Select the Karma run/debug configuration from the list of configurations and click
in the list or on the toolbar.
In the Debug tool window that opens, proceed as usual: step through the program, stop and resume program execution, examine it when suspended, explore the call stack and variables, set watches, evaluate variables, view actual HTML DOM, and so on.
Monitor code coverage
With PyCharm, you can also monitor how much of your code is covered with Karma tests. PyCharm displays this statistics in a dedicated Coverage tool window and marks covered and uncovered lines visually in the editor and in the Project tool window Alt+1. To monitor coverage, you need to install the karma-coverage package and update karma.conf.js.
Install karma-coverage
In the embedded Terminal (Alt+F12) , type:
npm install --save-dev karma-coverage
Add karma-coverage definition to the configuration file
Open karma.conf.js in the editor.
Locate the
reportersdefinition and addcoverageto the list of values in the format:reporters: ['progress', 'coverage']Add a
preprocessorsdefinition and specify the coverage scope in the format:preprocessors: {'**/*.js': ['coverage']}
Launch tests with coverage
Create a Karma run/debug configuration as described above.
Select the Karma run/debug configuration from the list of configurations and click
in the list or on the toolbar.
Alternatively, use the test icons in the editor to quickly run a specific suite or a test with coverage.

Monitor the code coverage in the Coverage tool window.
Every time Karma tests are run, a coverage report is actually generated on the disk. The format of a coverage report can be configured in the configuration file, for example:
// karma.conf.js module.exports = function(config) { config.set({ ... // optionally, configure the reporter coverageReporter: { type : 'html', dir : 'coverage/' } ... });};The following
typevalues are acceptable:htmlproduces a bunch of HTML files with annotated source code.lcovonlyproduces an lcov.info file.lcovproduces HTML + .lcov files. This format is applied by default.coberturaproduces a cobertura-coverage.xml file for easy Hudson integration.text-summaryproduces a compact text summary of coverage, typically to the console.textproduces a detailed text table with coverage for all files.