UI Overview
The current version of Qodana UI focuses on the single-shot analysis. It allows browsing and acting on results as well as reconfiguring the list of checks.
Problem Explorer
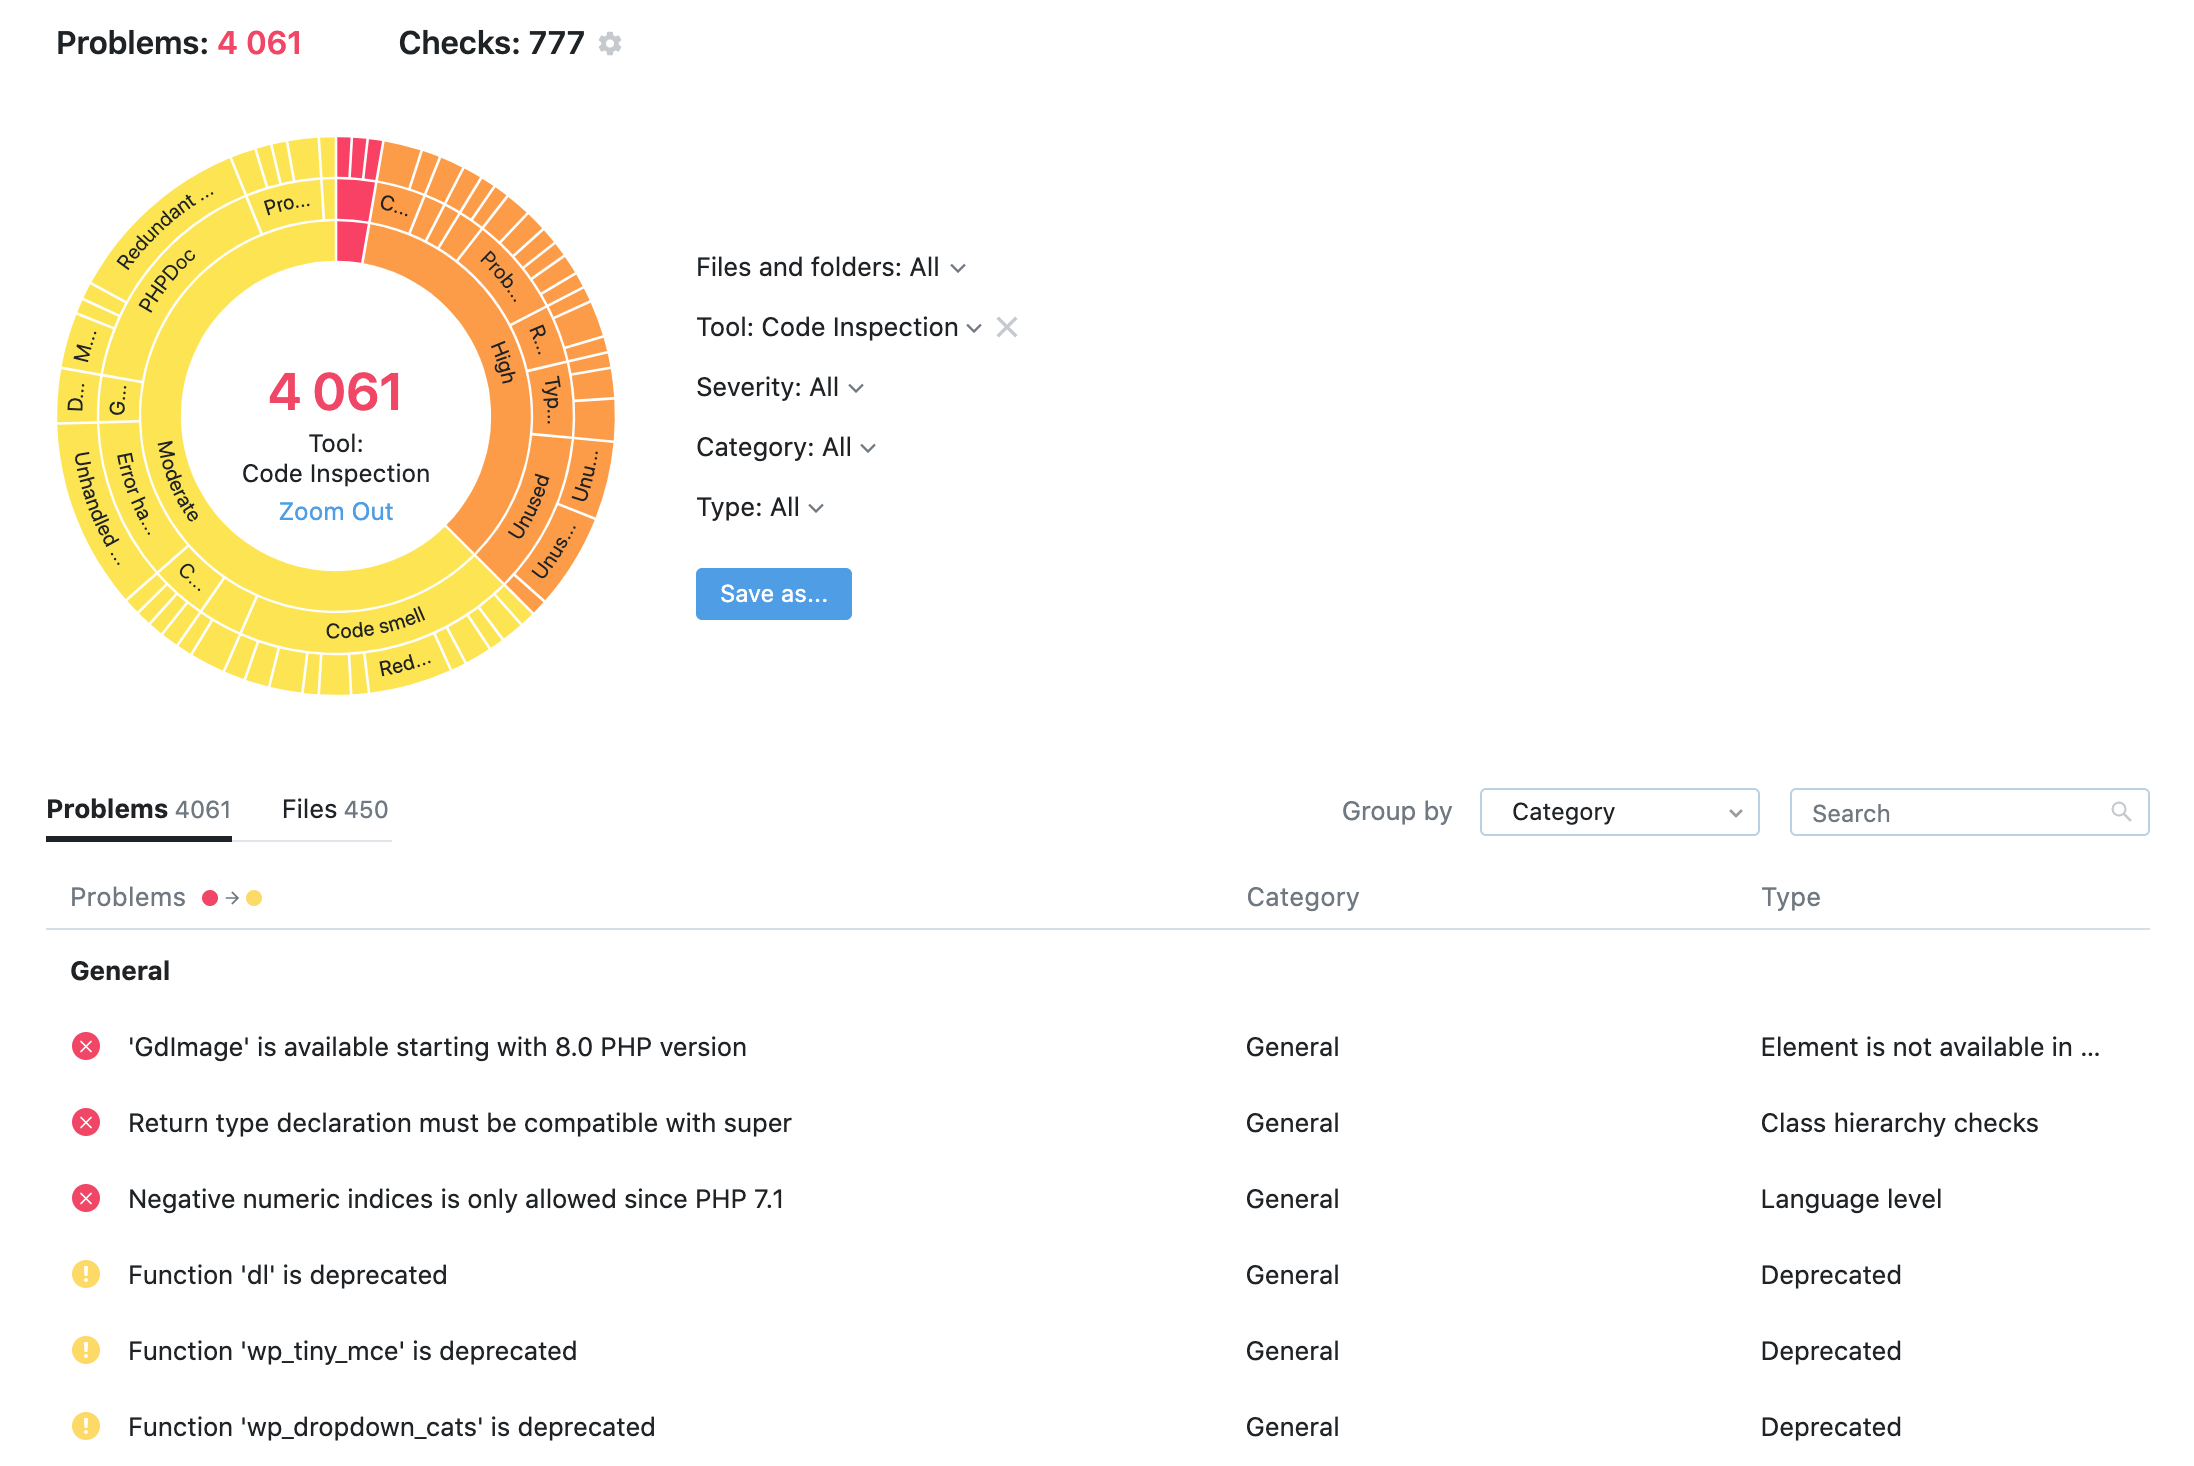
The interactive sunburst chart gives you an idea of how bad the situation is, what problems are the most prominent, and lets you drill down into the cause of the issue. This chart is a result of our initial research and experiments. We believe that this visual representation dramatically enhances understanding of the data, which allows us to create more insightful views.
We are open to feedback and encourage you to share your opinions and ideas with us! Feel free to contact us via qodana-support@jetbrains.com or our issue tracker.

Each line in the table under the sunburst chart is expandable and provides all the necessary details on the problem including the surrounding code. If you have JetBrains Toolbox installed, the Open in IDE button lets you quickly jump to the editor.
If you think that the problem is irrelevant, you can adjust the analysis based on the presumed reason:
The analysis of the file containing the error, or even the directory containing this file, doesn't make sense in your project. For example, it's actually not the source code but some generated or downloaded content
In this case, you can exclude a file or directory from the future analysis. Click the file path to navigate to File explorer where you can recheck the condition and mark the file/directory as excluded.


You suppose that the type of the error or its category is not relevant.
In this case you can use the hide action and remove the whole type or category.
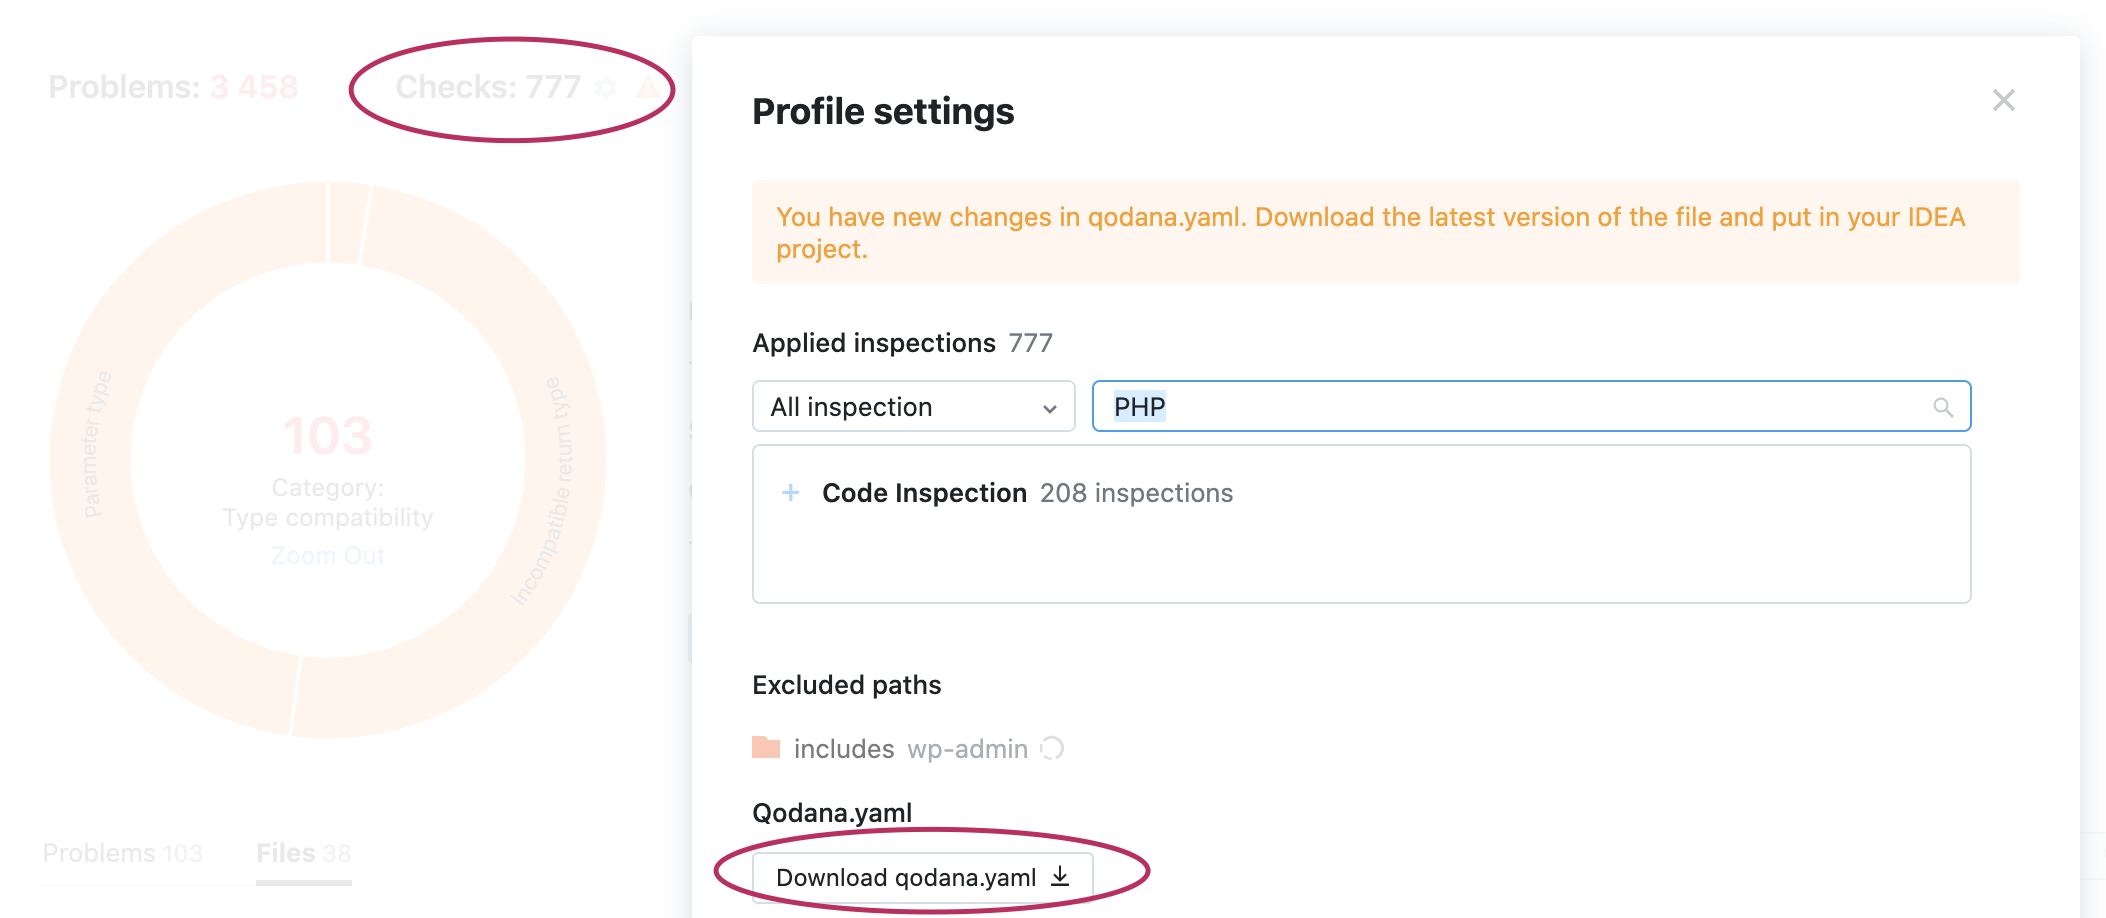
If you excluded either type/category or file/directory, the UI will remind you to save changes. Download the qodana.yaml file and store it under your project's root directory.
Files Explorer
The second tab in the Problems table shows problems grouped by files and directories.
Reviewing and Adjusting Configuration
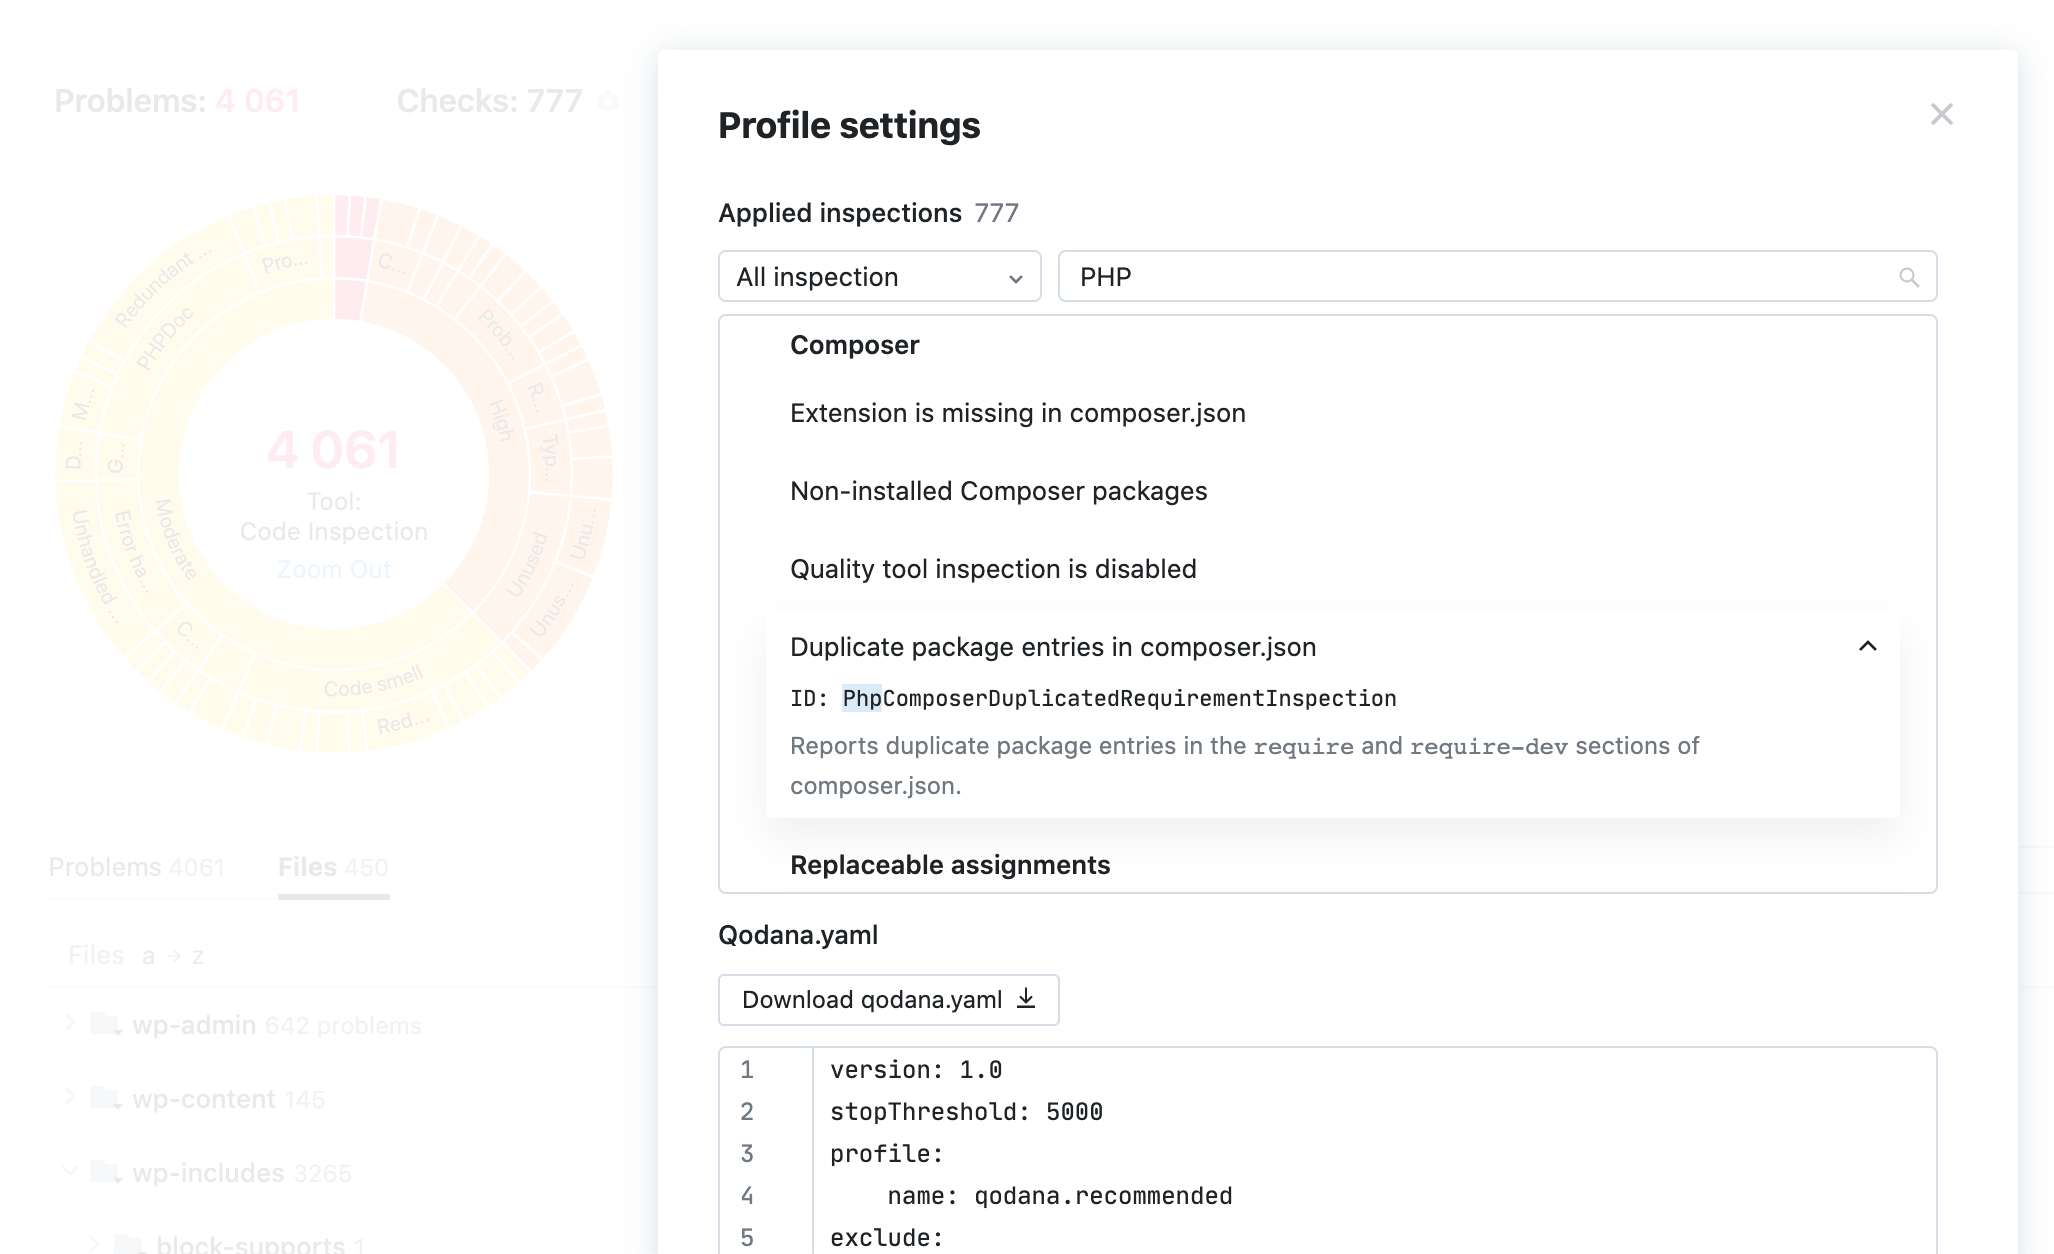
We believe that the ability to see what was checked is as important as the list of problems found. For example, if you haven't checked for typos, you can be happy to see zero typos in your project. There could be many of them – you just didn't check. So we've exposed the Checks section, which lets you easily see what's already included in the analysis, and you can also explore what you can add. Our recommended profile includes the most common inspections, but as you know your project better – you can fine-tune your experience.

You can Enable the inspection, and it will be added to your configuration. The UI will remind you to download and save qodana.yaml into your project root directory.

Run the analysis again with updated qodana.yaml and check that you see the expected results.
If the number of errors is manageable, you can fix them and consider the 'problem-free code' goal achieved. You are now ready to perform the analysis on a daily basis :) We suggest that you follow that goal and fix the errors as soon as they appear.
If there are too many errors, we suggest using the Qodana UI features to examine them. You can then formalize a not-so-big cluster of the problems to fix. Repeat the procedure to work on the next goal, and so on.
We are working on the so-called technical debt support, which will help in the situation when you have no possibility to fix old problems but want to prevent the appearance of new ones. Stay tuned!