TeamCity
Starting from 2022.04, Qodana functionality is available in TeamCity by default. To start using it, these prerequisites need to be met:
You use TeamCity as a build server for your project. If not, learn how to do it in TeamCity documentation.
Your project language is included in the list of fully supported technologies.
Add a Qodana runner
Assuming that you have already created your project and configured your build, follow the steps below.
Navigate to your build configuration.
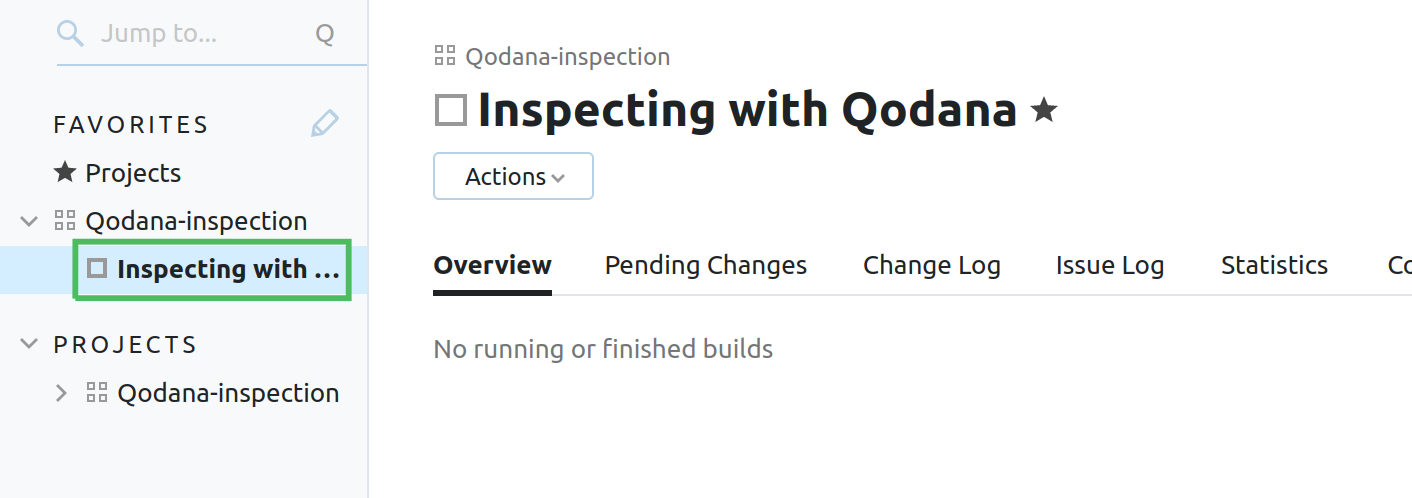
On the build configuration page, select Build Steps from the Edit configuration list.

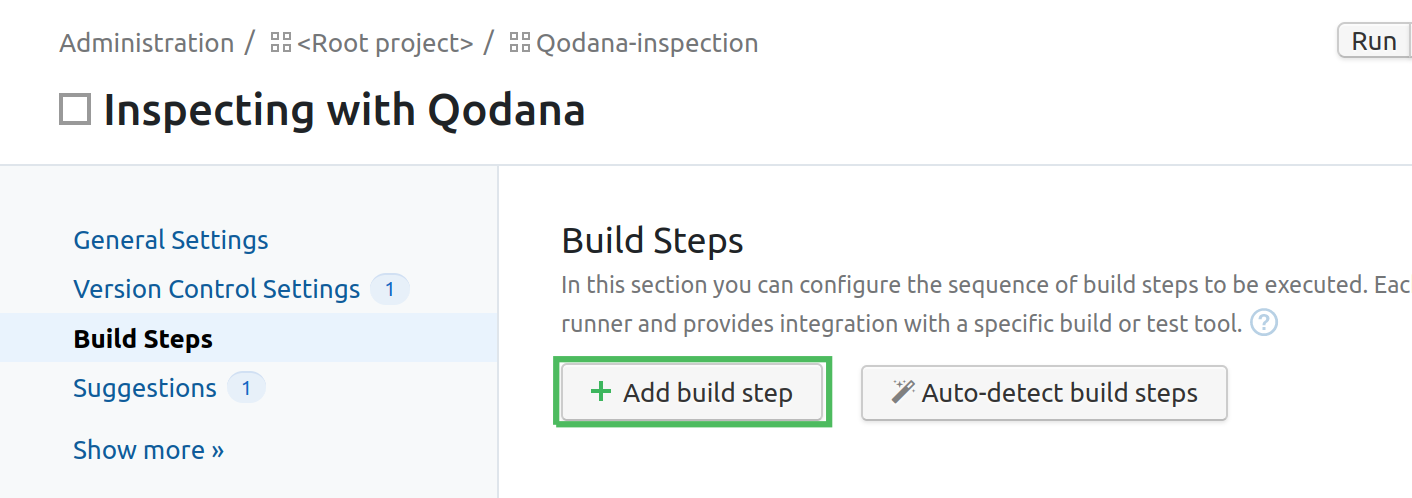
On the Build steps page, click the Add build step button.
From the Runner type list, select Qodana as a runner. On the New Build Step page, you can configure the
Qodanarunner using the basic options. Otherwise, click Show advanced options to expand the list of configuration options.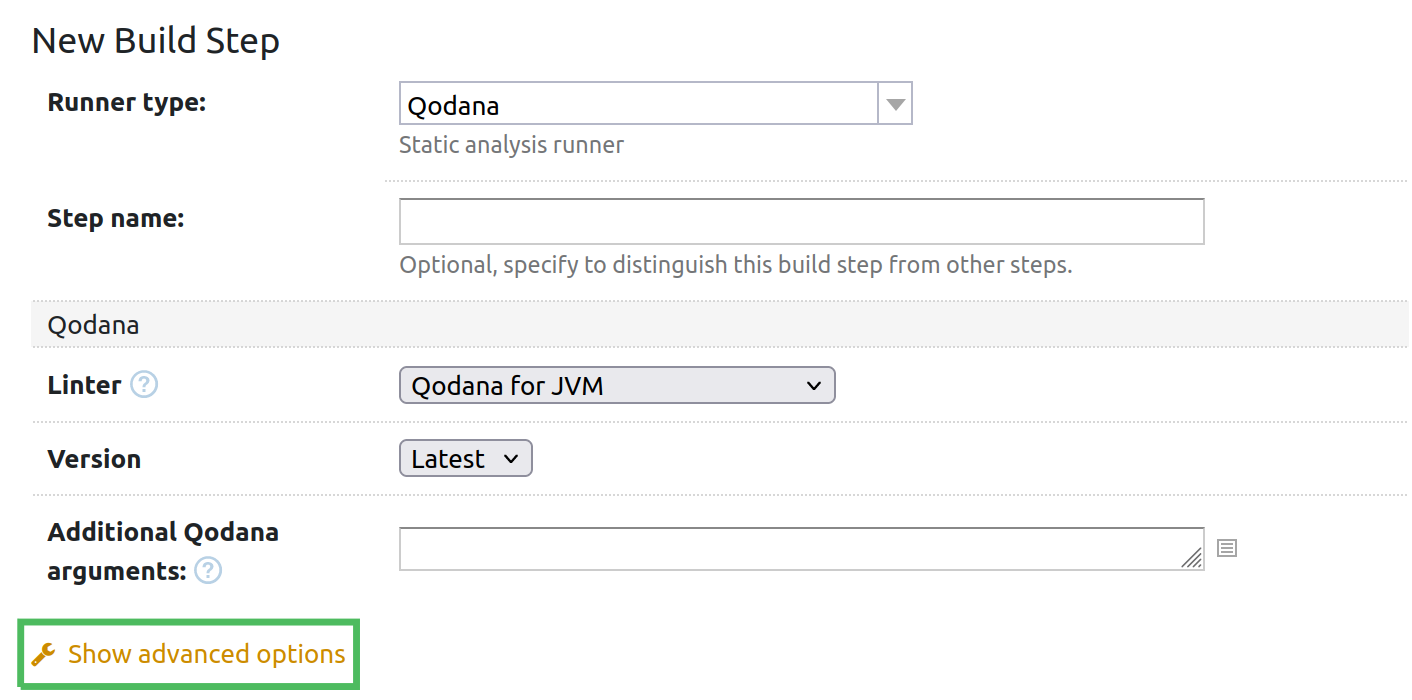
Fill in the fields using this description.
Step name uniquely identifies this step among other build steps.
Execute step configures the build condition that will trigger this build step.
Working directory sets the directory for the build process. For more information, see the TeamCity documentation. You can leave this field empty if the
Checkout directoryparameter is specified on the Version Control Settings tab.Report ID uniquely identifies the report to let you distinguish between multiple reports when several inspection steps are configured within a single build.
The Forward reports to TeamCity Tests checkbox configures forwarding all Qodana inspection reports to TeamCity Tests for further investigation.
Linter configures the Qodana Linter.
Version is by default set to
Latest.Inspection profile defines the inspection profile. For more information, see the Configure profile section. The available values are:
Recommended (default)is the default profile containing a preselected set of IntelliJ inspectionsEmbedded profilelets you select from any available profiles, see the Default profiles section for detailsPath to the IntelliJ profilelets you specify the path to a custom profile. Make sure that the.ideadirectory containing the profile file is added to your working directory.
You can disable certain inspections later using the
qodana.yamlfile or Profile settings in your HTML report.Additional arguments for 'docker run' configures the arguments accepted by a Docker image. For example, they can be the
-dor-changesparameters. For more information about arguments, see the Examples of execution tuneup section.Additional Qodana arguments lets you extend the default Qodana functionality, see the Configuration options for details.
Click Save. Now you can run Qodana in the build.
(Optional) Add a configuration script
Custom profile configuration for Qodana linters is stored in qodana.yaml. When using a CI system, you need to put this file to the working directory manually. Alternatively, you can write a script that will do it for you.
Navigate to your build configuration.

On the build configuration page, select Build Steps from the Edit configuration list.

On the Build steps page, click the Add build step button.

From the Runner type list, select Command Line. On the New Build Step page, you can configure the
Command Linerunner using the basic options. Otherwise, click Show advanced options to expand the list of configuration options.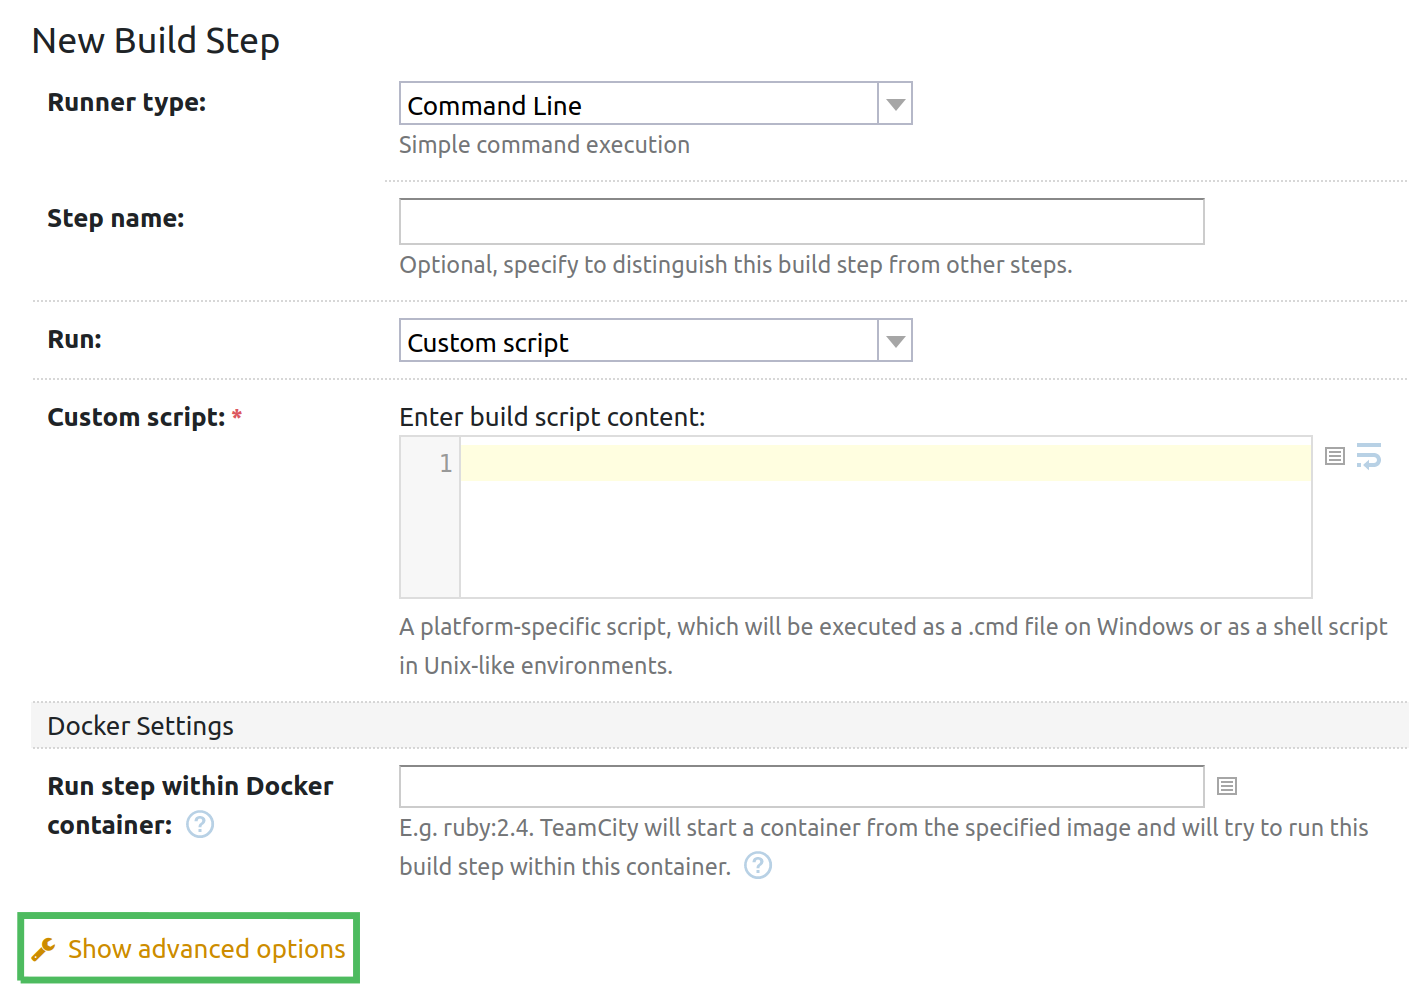
Fill in the fields using the Command Line runner description from the TeamCity documentation portal.
In the Custom script editor, paste a script that adds a custom
qodana.yamlto the working directory. In the example below, the script appends the following inspection exclusions to the configuration file:#!/bin/sh FILE="./qodana.yaml" /bin/cat <<EOM >$FILE exclude: - name: Annotator - name: AnotherInspectionId paths: - relative/path - another/relative/path - name: CloneFinder - name: ProhibitedDependencyLicense EOM
Verify inspection results
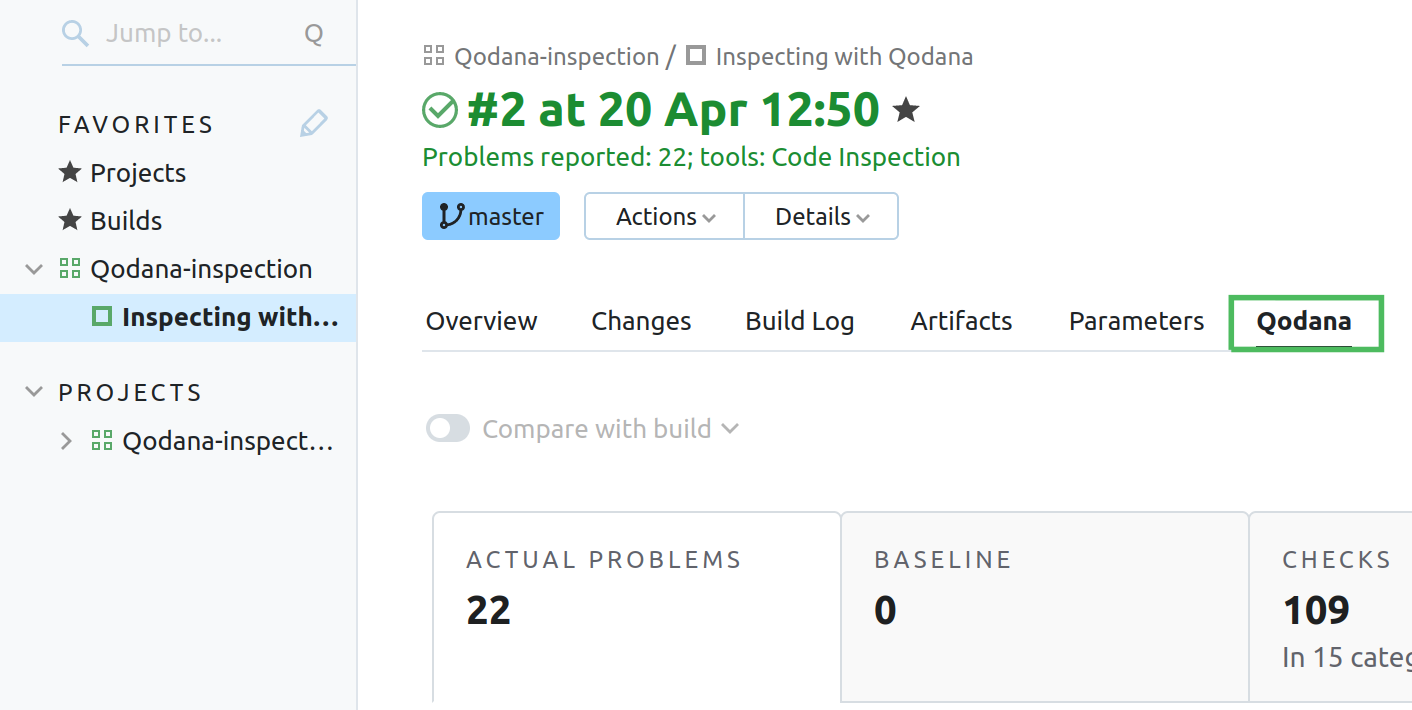
Now that you have configured and run the build, you can observe inspection results in the TeamCity UI.
Navigate to the project build page. In the Overview tab, click the build entry.
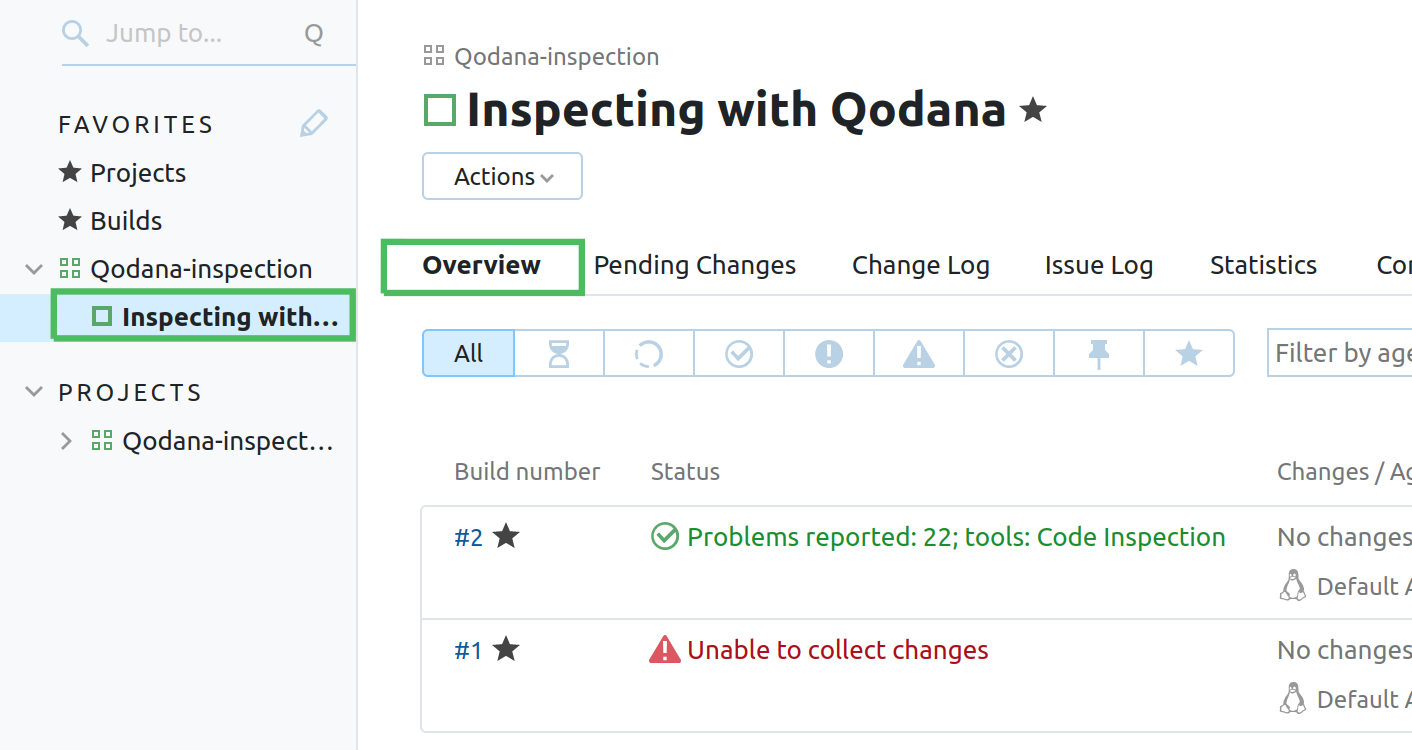
On the build page, navigate to the Qodana tab to find the inspection report. To learn more about Qodana reports, see the User interface overview section of this documentation.
