Qodana IDE plugin
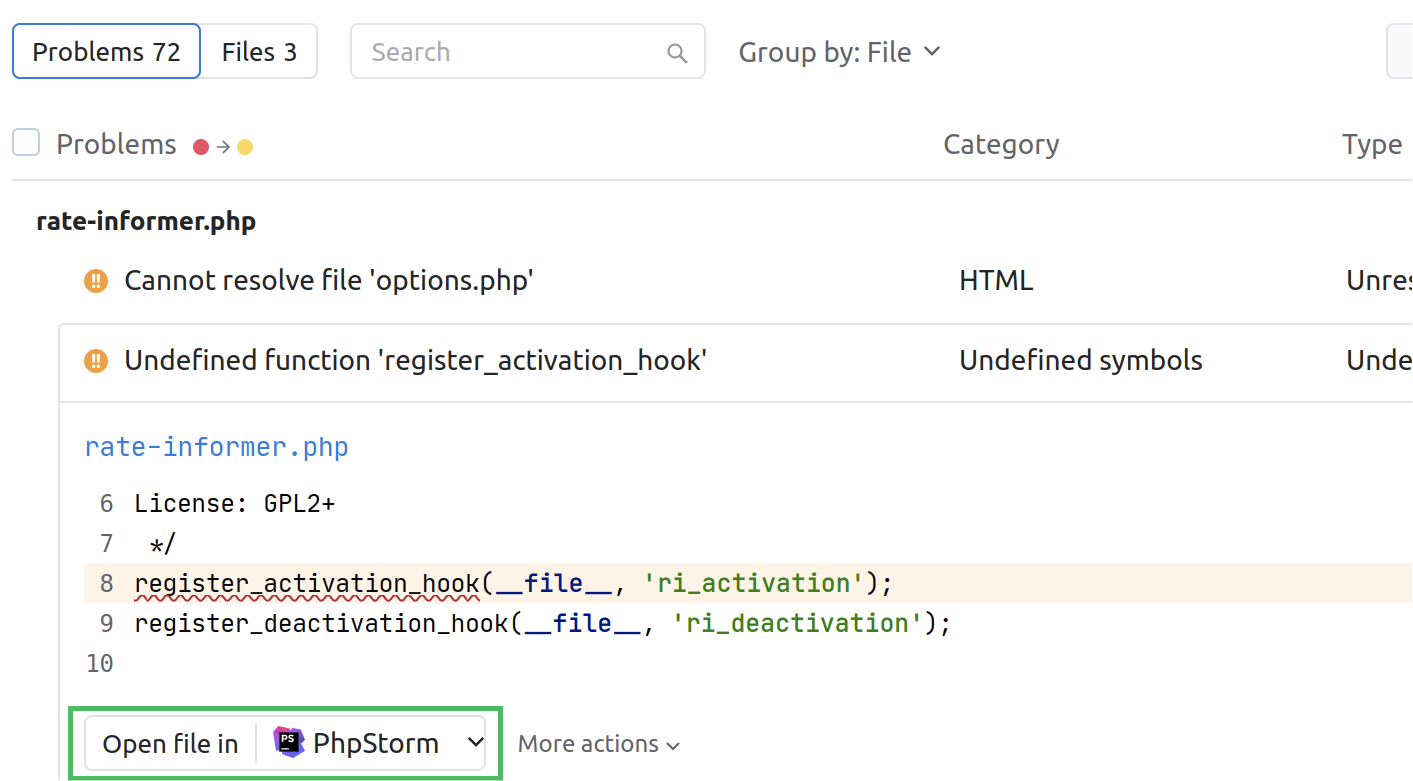
Edit page Last modified: 21 November 2022The Qodana IDE plugin is a JetBrains IDE plugin that provides a link between a Qodana report and your project opened in an IDE, so you can navigate between the problems detected by a linter and use the Open file in <IDE> functionality provided by the Qodana UI.
This plugin is available by default in all JetBrains IDEs starting from version 2021.3. Otherwise, you can install it using JetBrains Marketplace.
Before you start
Make sure your preferred IDE is installed via JetBrains Toolbox App.
Install the plugin for the IDE as described in the IntelliJ IDEA Documentation. IDE versions 2021.2 and later are supported.
Make sure that you previously opened the project by the IDE at least one time. This action establishes the link between the Qodana report and your IDE.
Now you can run Qodana to inspect your code, see the Qodana linters section for details.
Open a file from the Qodana UI
In the Qodana HTML report, choose a problem to navigate to and click Open file in <IDE>.

Open a Qodana report in the IDE
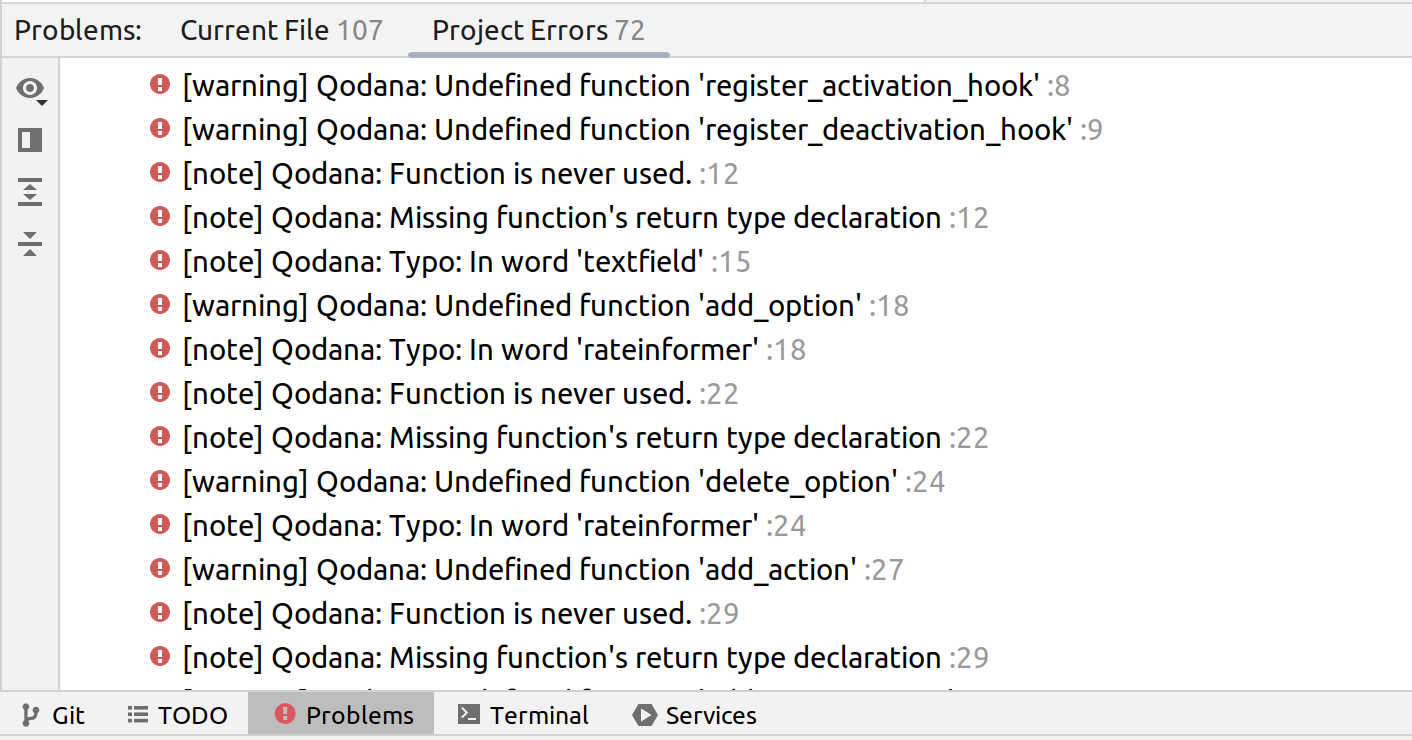
In the IDE, go to Tools | Open Qodana Analysis Report and select the
qodana.sarif.jsonreport file generated after a Qodana run. See Qodana code inspection output formats for details.In the Problems tool window that opens, you can view the detected issues and jump to the corresponding line in the code editor.

In case a problem was fixed before opening the qodana.sarif.json file, it is marked as [Not present].
Thanks for your feedback!