Inspect open-source projects
This section explains how you can inspect your open-source projects using Qodana, and how you can use Qodana Cloud to view Qodana inspection results in a convenient form and free for open-source projects.
Before you start
Depending on your needs, it may be useful to know how to:
Inspect your code using Qodana
Configure Qodana using
qodana.yamland Shell commandsRun Qodana either locally on in your CI/CD pipelines
Forward reports to Qodana Cloud
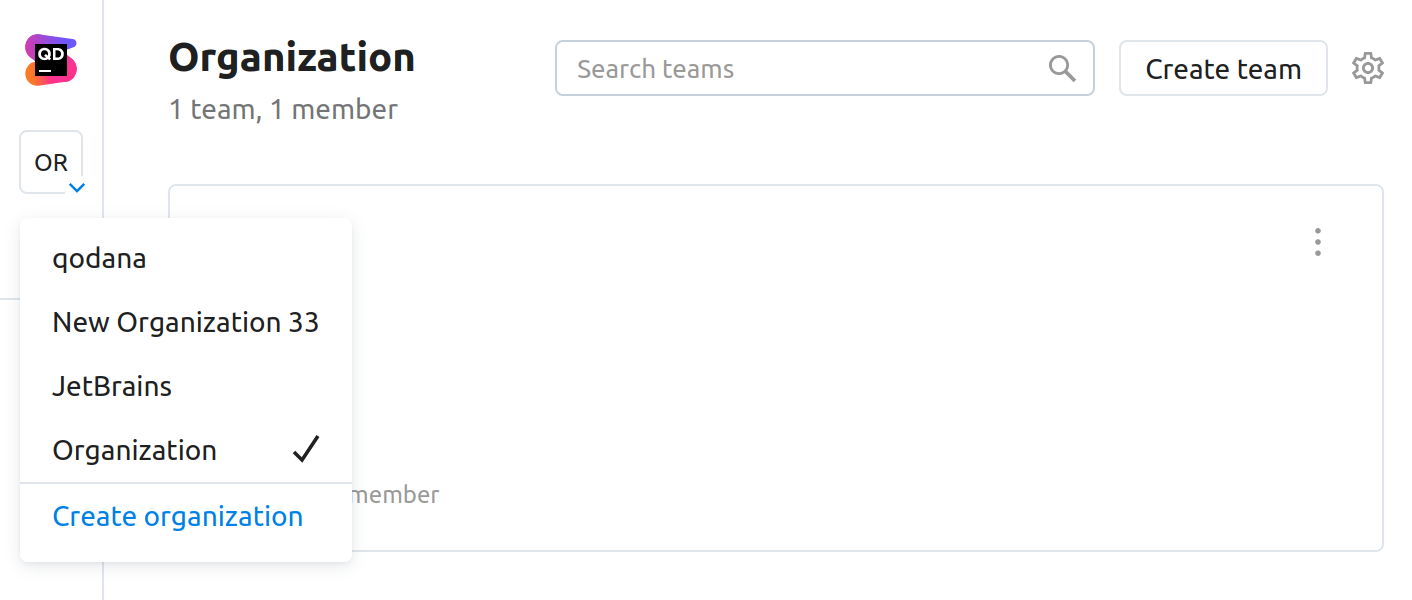
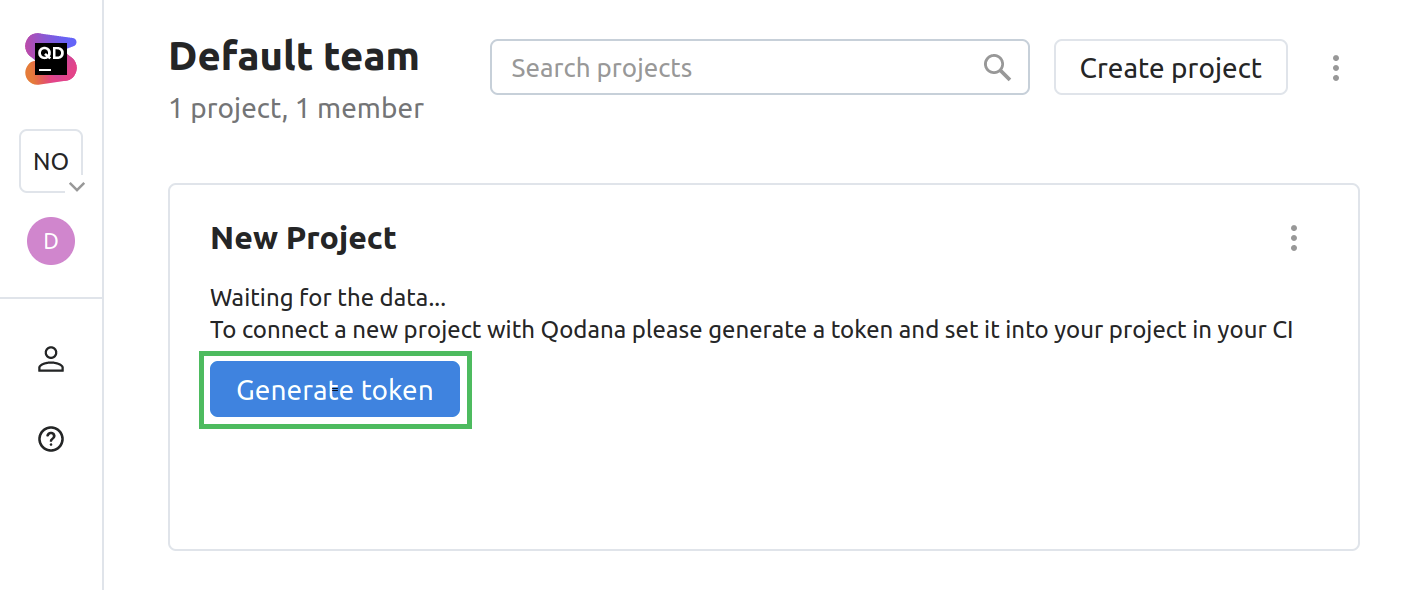
Prepare Qodana Cloud
If you plan to create a separate team and project in your Qodana Cloud account, follow the steps below.
Inspect your projects
You can inspect your codebase using methods described in the Inspect your code section.
Depending on the Qodana license, you can configure various features, for example:
Baseline for monitoring current and new problems
Inspections that you would like to use
License audit for checking license compatibility
Quality gate for restricting the number of problems
Here are the links to the sections that describe other available features:
Configure inspections
By default, Qodana inspects your code using the qodana.starter profile. You can use additional inspections by specifying the qodana.recommended profile in the qodana.yaml file contained in your project root:
To check the overall configuration of your project, you can employ the qodana.sanity profile:
Configure license audit
License audit lets you track compatibility of dependency licenses with your project license.
To enable the license audit, use the include option of the qodana.yaml file in your project root:
Configure baseline
Baseline lets you create a snapshot of your project that will be used as a basis for subsequent analysis. To enable it, select inspections and download the qodana.sarif.json file.
You can run Qodana with the baseline enabled using the --baseline option:
Configure the quality gate
Quality gate lets you configure the ultimate number of problems that will cause a CI/CD pipeline failure.
Once configured, a quality gate will make your CI/CD system:
Build the project only if the number of problems contained in it is below the configured threshold
Accept only the pull requests containing problems below the configured threshold
To enable the quality gate, you can use the fail-threshold <number> option.
Types of Qodana reports
Qodana can generate the following types of inspection reports:
Reports containing inspection results over a specific branch of your project
Pull or merge request inspection reports generated by GitHub Actions and GitLab CI/CD
GitHub Actions
Using this example, you can configure GitHub for:
Forwarding inspection results to Qodana Cloud
Blocking the merge of pull requests if a quality gate has failed
Follow these steps:
Create an encrypted secret with the
QODANA_TOKENname.Create a new or open an existing GitHub workflow that invokes the Qodana Scan action.
Set the workflow to run on
pull_requestevents that target themainbranch, and forward reports to Qodana Cloud based on theQODANA_TOKENvalue. Instead ofmain, you can specify your branch here.
Set the number of problems (integer) for the Qodana action
fail-thresholdoption.Under your repository name, click Settings.
On the left menu, click Branches.
In the branch protection rules section, click Add rule.
Add
mainto Branch name pattern.Select Require status checks to pass before merging.
Search for the
Qodanastatus check, then check it.Click Create.
GitLab CI/CD
Using this example, you can configure GitLab CI/CD for:
Inspecting the
mainbranch and all merge requestsBlocking merge requests if a quality gate has failed
Forwarding inspection results to Qodana Cloud
Follow these steps to add a Qodana runner to a GitLab CI/CD pipeline:
Create the
QODANA_TOKENvariable and save the Qodana Cloud project token value in itPaste this sample to the
.gitlab-ci.ymlfile:
In this sample, specify the Qodana linter and the quality gate using --fail-threshold option. Using this configuration, Qodana will inspect the main branch and all merge requests coming to your repository.
Inspection result overview
After your project is inspected and inspection results are uploaded to Qodana Cloud, you can view results as shown on this page.

