.NET
All Qodana linters are based on IDEs designed for particular programming languages and frameworks. To analyze .NET projects, you can use the following Qodana linters:
Linter name | Based on | Licensed under the licenses | Shipped as | |
|---|---|---|---|---|
Qodana for .NET | Ultimate and Ultimate Plus | A native solution and a Docker image | C#, C++, C, VB.NET, JavaScript, TypeScript | |
Qodana Community for .NET | Community | A Docker image | C#, C++, VB.NET |
You can compare these linters by programming languages and other supported technologies by navigating to the feature matrix.
Before your start
Qodana Cloud
To run linters, you need to obtain a project token that will be used by Qodana for identifying and verifying a license.
Navigate to Qodana Cloud and create an account there.
In Qodana Cloud, create an organization, a team, and a project.
On the project card, you can find the project token that you will be using further in this section.
A project token is required for the Qodana for .NET linter and optional for the Qodana Community for .NET linter.
SDK version
If you project targets the .NET framework or [OS-specific TFMs](https://learn.microsoft.com/en-us/dotnet/standard/frameworks#net-5-os-specific-tfms), the only option in this case is to run the Qodana for .NET linter in the [native mode](native-mode.md).
If you run Qodana for .NET in the native mode, you should handle SDK availability for Rider.
The Dockerized version of Qodana for .NET provides the following SDK versions:
6.0.417,
7.0.404,
8.0.100.
All SDK versions are stored in the /usr/share/dotnet/sdk directory of the Qodana container filesystem.
In case a project requires a different version of the SDK, you can set it using the bootstrap key in the qodana.yaml file. For example, this command will install the required version of the SDK that is specified in the global.json file and located in the root of your project:
Prepare your software
This shows how to configure software from this section to Qodana analysis. All configuration samples use a project token, see the Qodana Cloud for details.
You can run Qodana using the Qodana Scan GitHub action.
On the tab of the GitHub UI, create the
QODANA_TOKENencrypted secret and save the project token as its value.On the tab of the GitHub UI, set up a new workflow and create the
.github/workflows/code_quality.ymlfile. This file will be used for further examples.
Make sure that these plugins are installed on your Jenkins instance:
Docker and Docker Pipeline are required for running Docker images,
git is required for git operations in Jenkins projects.
Make sure that Docker is installed and accessible by Jenkins.
If applicable, make sure that Docker is accessible by the
jenkinsuser as described in the Manage Docker as a non-root user section of the Docker documentation.Create a Multibranch Pipeline project as described on the Jenkins documentation portal.
In the root directory of your project repository, save the
Jenkinsfile.
Make sure that your project repository is accessible by GitLab CI/CD.
In the root directory of your project, create the
.gitlab-ci.ymlfile that will contain configurations for running Qodana.
Assuming that you have already created your project and build configuration, follow the steps below.
In the TeamCity UI, navigate to the configuration page of a build where you would like to run Qodana.
On the page, click the button.
On the page that opens, select the runner.
On the page, click and configure the runner:
uniquely identifies this step among other build steps.
uniquely identifies this step among other build steps.
configures the build condition that will trigger this build step.
sets the directory for the build process, see the TeamCity documentation for details. You can leave this field empty if the
Checkout directoryparameter is specified on the tab.uniquely identifies the report to let you distinguish between multiple reports when several inspection steps are configured within a single build.
The checkbox configures Qodana report availability in the Test tab of the TeamCity UI. Using this option, you can view codebase problems along with other problems detected.
configures the Qodana linter.
is by default set to
Latest.defines an inspection profile:
Recommended (default)is one of the default profiles.Embedded profilelets you select a default profile, see the Existing Qodana profiles section for details.Path to the IntelliJ profilelets you specify the path to your custom profile. To use this option, make sure that you also configure the custom profile in theqodana.yamlfile.
configures a project token generated in Qodana Cloud.
configures the arguments accepted by a Docker image, see the Shell commands section for details.
lets you extend the default Qodana functionality, see the Options section for details.

Click the button.
You have two options to run Qodana locally: you can either run Qodana CLI or directly use the Docker image of Qodana. As Qodana linters are distributed in Docker containers, Docker needs to be installed on your local machine. If you are using Linux, you should be able to run Docker under your current non-root user, check the installation page for details.
In Rider, navigate to .
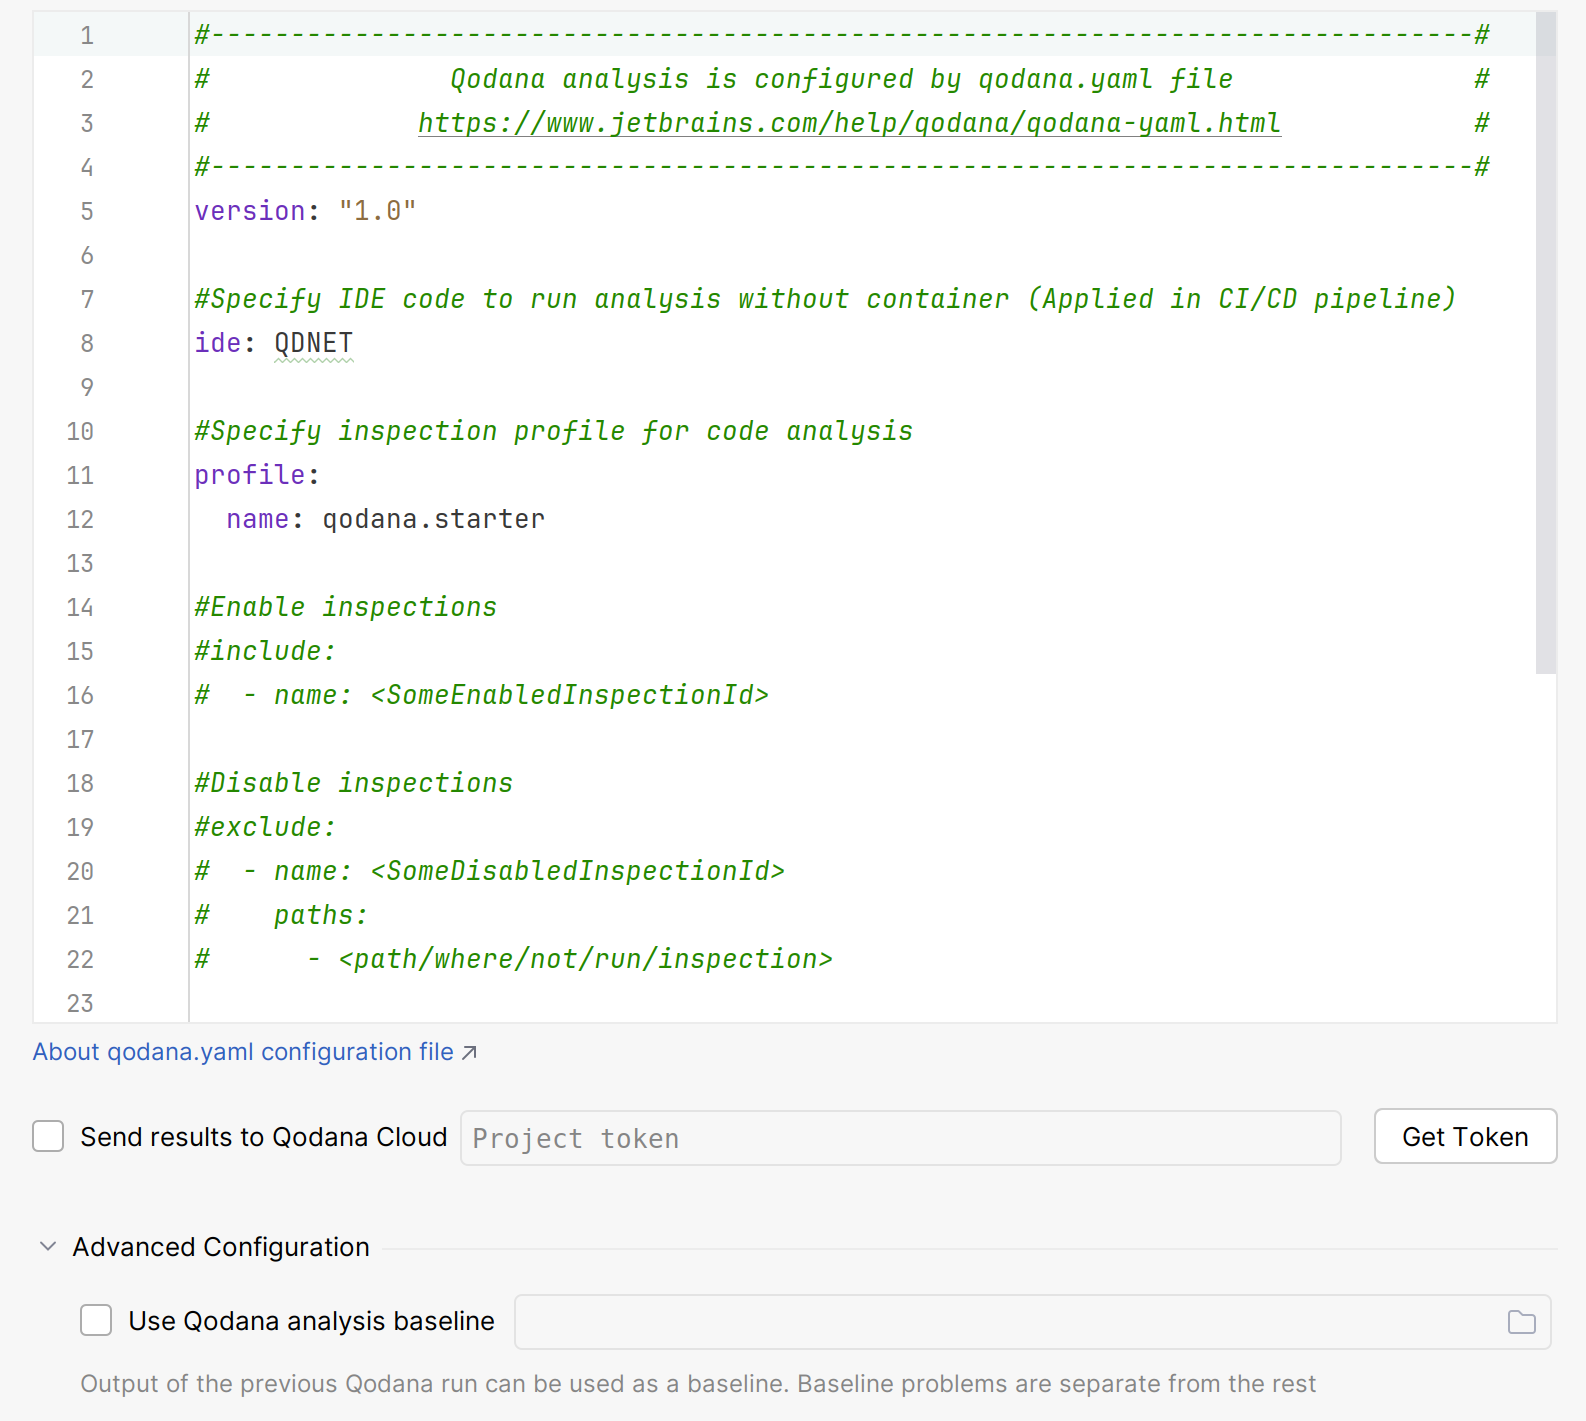
On the dialog, you can configure Qodana.

This dialog contains the following components:
Name
Description
The
qodana.yamlfileIn the text field, you can set up code analysis used by Qodana in this file. You can learn more about available configuration options
The option
If you want to send reports to Qodana Cloud, you can check this option and paste the project token generated in Qodana Cloud
The option
By checking this option, you can save the Qodana configuration made on this dialog to the
qodana.yamlfile in the project root of your projectThe option
Using the baseline feature, you can skip analysis for specific problems
Click for analyzing your code.
On the tab of the tool window, see the inspection results.
Build the project
We recommend that you build a project before Qodana analyzes it. To build it, you can use the bootstrap key of the qodana.yaml file contained in your project directory. This is especially recommended if you employ source generators.
If the project build fails, code analysis cannot be performed.
The Qodana Community for .NET linter builds your project by default before analysis. If you wish to run your custom build, use the --no-build Qodana option:
This is the GitHub Actions configuration sample invoking the --no-build option:
Save this snippet to the Jenkinsfile:
Using the field of the Qodana runner configuration, you can configure the --no-build option.
In Rider, navigate to .
On the dialog, you can configure Qodana.

This dialog contains the following components:
Name
Description
The
qodana.yamlfileIn the text field, you can set up code analysis used by Qodana in this file. You can learn more about available configuration options
The option
If you want to send reports to Qodana Cloud, you can check this option and paste the project token generated in Qodana Cloud
The option
By checking this option, you can save the Qodana configuration made on this dialog to the
qodana.yamlfile in the project root of your projectThe option
Using the baseline feature, you can skip analysis for specific problems
Click for analyzing your code.
On the tab of the tool window, see the inspection results.
Run Qodana
You can run the Qodana for .NET linter in two modes:
The native mode is the recommended method for running the Qodana for .NET linter that lets you run the linter without using Docker containers,
Container mode is an alternative that involves Docker containers of the Qodana for .NET linter.
Using a YAML configuration is the preferred method of configuring the linter because it lets you use such configuration across all software that runs Qodana without additional configuration.
You can configure the native mode by adding this line to the qodana.yaml file:
Alternatively, you can implement the native mode configuration as shown in examples below.
On the tab of the GitHub UI, create the
QODANA_TOKENencrypted secret and save the project token as its value.On the tab of the GitHub UI, set up a new workflow and create the
.github/workflows/code_quality.ymlfile.To inspect the
mainbranch, release branches and the pull requests coming to your repository in the native mode, save this workflow configuration to the.github/workflows/code_quality.ymlfile:name: Qodana on: workflow_dispatch: pull_request: push: branches: # Specify your branches here - main # The 'main' branch - 'releases/*' # The release branches jobs: qodana: runs-on: ubuntu-latest permissions: contents: write pull-requests: write checks: write steps: - uses: actions/checkout@v3 with: ref: ${{ github.event.pull_request.head.sha }} # to check out the actual pull request commit, not the merge commit fetch-depth: 0 # a full history is required for pull request analysis - name: 'Qodana Scan' uses: JetBrains/qodana-action@v2024.1 with: args: --ide,QDNET env: QODANA_TOKEN: ${{ secrets.QODANA_TOKEN }}This configuration invokes the native mode using:
with: args: --ide,QDNET
Save this snippet to the Jenkinsfile:
See the Prepare your software section for details.
Run this command in the project root directory:
Here, the --ide option downloads and employs the JetBrains IDE binary file.
Alternatively, in the qodana.yaml file save ide: QDNET, and then run Qodana using the following command:
In Rider, navigate to .
On the dialog, you can configure:
Options used by Qodana and configured by the
qodana.yamlfile. You can see that the native mode is already configured.The option using a project token.

Click for analyzing your code.
In the tool window, see the inspection results.
The container mode is available for the Qodana for .NET linter; however, we recommend that you use the native mode.
On the tab of the GitHub UI, create the
QODANA_TOKENencrypted secret and save the project token as its value.On the tab of the GitHub UI, set up a new workflow and create the
.github/workflows/code_quality.ymlfile.To analyze the
mainbranch, release branches and the pull requests coming to your repository in the container mode, save this workflow configuration to the.github/workflows/code_quality.ymlfile:name: Qodana on: workflow_dispatch: pull_request: push: branches: # Specify your branches here - main # The 'main' branch - 'releases/*' # The release branches jobs: qodana: runs-on: ubuntu-latest permissions: contents: write pull-requests: write checks: write steps: - uses: actions/checkout@v3 with: ref: ${{ github.event.pull_request.head.sha }} # to check out the actual pull request commit, not the merge commit fetch-depth: 0 # a full history is required for pull request analysis - name: 'Qodana Scan' uses: JetBrains/qodana-action@v2024.1 env: QODANA_TOKEN: ${{ secrets.QODANA_TOKEN }}
Save this snippet to the Jenkinsfile:
See the Prepare your software section for details.
Start local analysis with source-directory pointing to the root of your project and QODANA_TOKEN referring to the project token:
In Rider, navigate to .
On the dialog, you can configure:
Options used by Qodana and configured by the
qodana.yamlfile. You can see that the native mode is already configured.The option using a project token.

Click for analyzing your code.
In the tool window, see the inspection results.
You can run the Qodana Community for .NET linter in a container mode as shown in the examples below.
On the tab of the GitHub UI, create the
QODANA_TOKENencrypted secret and save the project token as its value.On the tab of the GitHub UI, set up a new workflow and create the
.github/workflows/code_quality.ymlfile.To analyze the
mainbranch, release branches and the pull requests coming to your repository in the container mode, save this workflow configuration to the.github/workflows/code_quality.ymlfile:name: Qodana on: workflow_dispatch: pull_request: push: branches: # Specify your branches here - main # The 'main' branch - 'releases/*' # The release branches jobs: qodana: runs-on: ubuntu-latest permissions: contents: write pull-requests: write checks: write steps: - uses: actions/checkout@v3 with: ref: ${{ github.event.pull_request.head.sha }} # to check out the actual pull request commit, not the merge commit fetch-depth: 0 # a full history is required for pull request analysis - name: 'Qodana Scan' uses: JetBrains/qodana-action@v2024.1 env: QODANA_TOKEN: ${{ secrets.QODANA_TOKEN }}
Save this snippet to the Jenkinsfile:
See the Prepare your software section for details.
Start local analysis with source-directory pointing to the root of your project and QODANA_TOKEN referring to the project token:
In Rider, navigate to .
On the dialog, you can configure:
Options used by Qodana and configured by the
qodana.yamlfile. You can see that the native mode is already configured.The option using a project token.

Click for analyzing your code.
In the tool window, see the inspection results.
Analyze a specific solution
By default, Qodana tries to locate and employ a single solution file, or, if no solution file is present, it tries to find a project file. If your project contains multiple solution files, you need to specify the exact filename as shown below.
Specify a solution
You can specify a solution in various ways. Using a YAML configuration is the most convenient method because you can configure it once and use the configuration across all software that runs Qodana.
YAML file
Specify the relative path to the solution file from the project root:
If your project contains no solution files and multiple project files, you need to employ a project file:
Docker
The Qodana for .NET linter uses the --property option, while the Qodana Community for .NET linter uses the --solution option to specify a path to a solution file:
If your project contains no solution files and multiple project files, you need to employ a project file using the --property and --project options:
Configure a solution
A solution configuration defines which projects in the solution to build, and which project configurations to use for specific projects within the solution.
Every solution contains the Debug and Release configurations that you can employ as shown below.
YAML file
You can switch configurations of the current solution in the qodana.yaml file:
By default, the solution platform is set to Any CPU, and you can override it, for example:
Docker
You can apply a configuration using the --property and --configuration options:
By default, the solution platform is set to Any CPU, and you can override it as shown below:
Private NuGet repositories
Depending on the linter, you can run them using private NuGet repositories as shown below.
If you run Qodana for .NET using private NuGet repositories, the native mode of this linter is the recommended method of running. In this case, you do not have to additionally configure the linter, and if you run it on the same machine where you have built the project, it will be able to have access to the same feeds.
Alternatively, use this configuration to employ a Docker image of the Qodana for .NET linter:
Other configuration examples are available on our GitHub repository.
In the local filesystem, create the folder that will contain cache. For example, it can be
C:/Temp/QodanaCache.Run Qodana using the
--cache-dir C:/Temp/QodanaCacheoption.Copy all NuGet packages contained by default in the
%userprofile%\.nuget\packagesfolder toC:/Temp/QodanaCache/nuget. If you have a custom package folder, copy packages from that folder instead of%userprofile%\.nuget\packages.Run Qodana using the
--cache-dir C:/Temp/QodanaCacheonce more.
Explore analysis results
JetBrains IDEs
You can get the latest Qodana report in your IDE as explained below.
In your IDE, navigate to .
On the dialog, click .

This will redirect you to the authentication page.
Select the Qodana Cloud project to link your local project with.

By enabling the option, you get actual reports automatically retrieved from Qodana Cloud.

In this case, the IDE will search and fetch from Qodana Cloud the report that has the revision ID corresponding to the current revision ID (HEAD). If this report was not found, the IDE will select the previous report with the revision closest to the current revision ID (HEAD). Otherwise, the IDE retrieves the latest available report from Qodana Cloud.
On the tab of the tool window, view analysis results.
Qodana Cloud
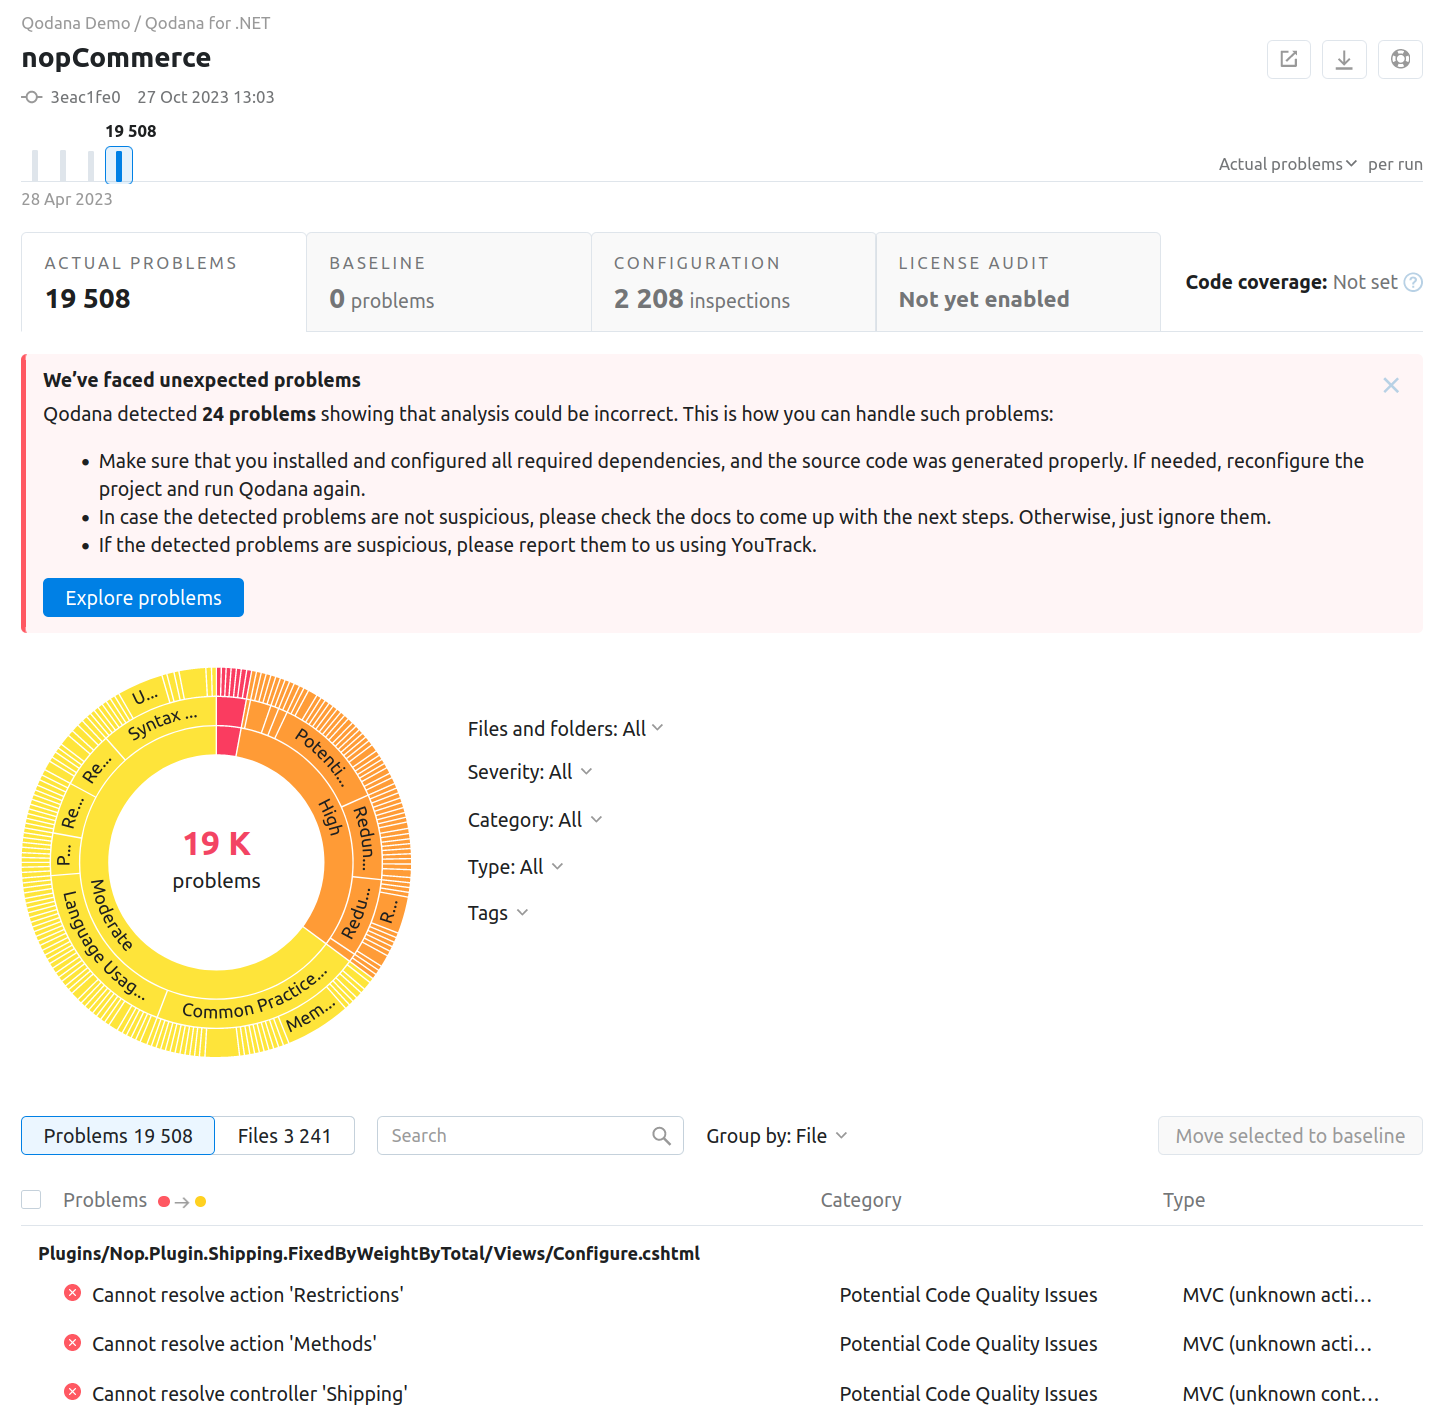
Once Qodana analyzed your project and uploaded the analysis results to Qodana Cloud, in Qodana Cloud navigate to your project and review the analysis results report.

To learn more about Qodana report UI, see the Inspection report section.
Extend the configuration
Adjust the scope of analysis
Qodana for .NET
Qodana for .NET reads configuration from the qodana.yaml file located in the root directory of your project. For example, add this configuration to run the linter using the qodana.recommended inspection profile:
You can analyze your code using Roslyn analyzers with each analyzer considered as a separate inspection. You can configure Roslyn analyzers as explained in the section. This is an experimental feature, so use them at your own risk.
To disable Roslyn analyzers, you can configure the Qodana profile using the qodana.yaml file, for example:
Configuration examples are available on GitHub.
If you are familiar with configuring code analysis via Rider inspection profiles, you can pass the reference to the existing profile by mapping the profile:
Qodana Community for .NET
If you have previously worked on the target solution with ReSharper, you may have already configured code inspections settings. If so, InspectCode will find your custom settings in .DotSettings files and apply them. If there are no settings files, then the default severity levels will be used for all analyses. Besides custom severity levels for code inspections, InspectCode will look for the following settings in .DotSettings files:
Whether the solution-wide analysis is enabled.
Naming rules (this can only be configured using
.DotSettingsfiles).Files, file masks, and regions with generated code, where the code analysis is partly disabled (this can only be configured using
.DotSettingsfiles).A place where the code analysis engine should store caches. You can specify it on the Environment | General page of ReSharper options.
Target languages (ReSharper | Options | Environment | Products — Features).
To configure InspectCode on a CI server, make all configurations locally with ReSharper, save the settings to the Solution Team-Shared layer, and then commit the resulting YourSolution.sln.DotSettings file in the solution directory to your VCS. InspectCode on the server will find and apply these settings.
By default, InspectCode also runs Roslyn analyzers on the target solution. To configure Roslyn analyzers, see the section.
To disable Roslyn analyzers, in the solution's .DotSettings file add the following configuration:
EditorConfig
If you use EditorConfig to maintain code styles for your project, you can also configure code inspections from .editorconfig files.
As EditorConfig convention suggests, InspectCode will apply inspection settings defined in files named .editorconfig in the directory of the current file and in all its parent directories until it reaches the root filepath or finds an EditorConfig file with root=true. File masks specified in .editorconfig files, for example *Test.cs are also taken into account.
Inspection settings in .editorconfig files are configured similarly to other properties — by adding the corresponding lines:
For example, you can change the severity level of the Possible 'System.NullReferenceException' inspection to Error with the following line:
or you can disable the Redundant argument with default value inspection with the following line:
You can find EditorConfig property for each inspection on pages in the Code inspection index section as well as on the Index of EditorConfig properties page. — just use the browser search to find the property for the desired inspection.
Enable the baseline
You can skip analysis for specific problems using the baseline feature.
JetBrains IDEs
In your IDE, navigate to the tool window.
In the tool window, click the tab.
On the tab, click the button.
On the dialog that opens, expand the section and specify the path to the baseline file, and then click .
GitHub Actions
This snippet contains the args: --baseline,qodana.sarif.json line that specifies the path to the SARIF-formatted file containing a baseline:
Command line
In these snippets, the --baseline option configures the path to the SARIF-formatted file containing a baseline:
Enable the quality gate
You can configure quality gates for the total number of project problems, specific problem severities, and code coverage by saving this snippet to the qodana.yaml file:
Analyze pull requests
GitHub Actions
Because the Qodana Scan GitHub action automatically analyzes all pull requests, you can use.
Local run
To analyze changes in your code, employ the --diff-start option and specify a hash of the commit that will act as a base for comparison:
Usage statistics
According to the JetBrains EAP user agreement, we can use third-party services to analyze the usage of our features to further improve the user experience. All data will be collected anonymously. You can disable statistics by using the --no-statistics=true CLI option, for example:
Supported technologies and features
Support for | Name | Qodana for .NET | Qodana Community for .NET |
|---|---|---|---|
Programming languages | C# C++ * VB.NET ** C * JavaScript TypeScript | ✔ All from the list | ✔ ✔ ✔ ❌ ❌ ❌ |
Frameworks and libraries | .NET Framework .NET Core Handlebars/Mustache Less Node.JS NUnit Pug/Jade Sass/SCSS Unity Unreal Engine Vue Xunit | ✔ All from the list | ❌ None |
Databases and ORM | MongoDB MySQL Oracle PostgreSQL SQL SQL server | ✔ All from the list | ❌ None |
Markup languages | HTML XML CSS JSON and JSON5 RELAX NG T4 XPath XSLT YAML | ✔ All from the list | ✔ ✔ ❌ ❌ ❌ ❌ ❌ ❌ ❌ |
Scripting languages | Shell script | ✔ | ❌ |
Build management | MSBuild | ✔ | ❌ |
Qodana features | ✔ All from the list | ✔ ✔ ❌ ❌ |
* C and C++ inspections are applicable for projects containing .sln files.
** Supports Visual Basic inspections only.