Unit Testing Assistance in JavaScript
ReSharper helps you discover and run unit tests of QUnit and Jasmine frameworks right in Visual Studio.
With ReSharper, you can execute a single unit test, all tests in a file, project or solution. You can also execute any number of tests combined in a test session.
Configuring JavaScript unit testing preferences
If you use Jasmine framework, make sure to select the framework version on the page of ReSharper options (Alt+R, O).
By default, when the tests are started, ReSharper launches default web browser to show output from the unit testing framework. It runs the tests and reports the information back to ReSharper. If necessary, you can change the browser on the page of ReSharper options. You can also choose to run tests with PhantomJS library without launching a browser. To do so, select PhantomJS and specify the path to the PhantomJS executable file and change the default command line arguments, if necessary.
You can specify a custom HTML harness for your tests. The harness is compatible with the Chutzpah test runner and can use the special Chutzpah placeholders.
Use a custom HTML harness
Tick the Enable custom HTML harness checkbox on the page of ReSharper options (Alt+R, O).
If you do not have a harness file, you can create an empty HTML file, click the Copy default implementation to clipboard and paste the default harness template into the file.
Type a filename or path for the harness file.
Using the Test harness location selector, specify how the filename or path should be treated by the test runner.
Click Save in the Options dialog to apply the modifications and let ReSharper choose where to save them, or save the modifications to a specific settings layer using the Save To list. For more information, see manage and share resharper settings.
Discovering tests in current document
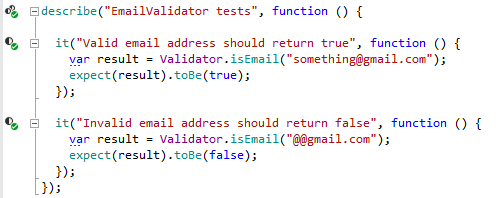
ReSharper discovers unit test suites and single unit tests of all supported frameworks right in the editor and adds the corresponding action indicators next to each item in the editor:
The example below shows a unit test suite created using the Jasmine framework:

| The function is a unit test that you can run |
| The function is a unit test suite and you can run containing tests |
| The unit test has passed during the last execution. |
| Tests in the unit test suite have passed during the last execution. |
| The unit test has failed during the last execution. |
| At least one test in the unit test suite has failed during the last execution. |
Run, debug, or cover tests in the current document
There are several ways to run unit tests in the current document. You can use action indicators, main menu or shortcuts:
To run a single test or all tests in a test class, click the action indicator next to it or set the caret at the test /test suite and press Alt+Enter. In the action list, choose Run for a test or Run All for a test suite.
Alternatively, you can use the Run Unit Tests
.png) Control+T R commands, which are also available in the main menu () and in the context menu. These commands work differently depending on the caret position or selection in the editor:
Control+T R commands, which are also available in the main menu () and in the context menu. These commands work differently depending on the caret position or selection in the editor:To run a single test or all tests in a test suite, set the caret at the test/test suite name, or anywhere inside its declaration in the editor .
To run several tests, select the desired tests in the editor .
To run all tests in the current file, either select all or set the caret outside test suites.
Whatever way you choose to run tests, you will see the execution progress, results, and output in the Unit Test Sessions window. If there is an open unit test session, the executed tests are added to that session. If there are no test sessions or the existing ones are locked, then a new tests session is created.
If necessary, you can always re-run the tests that you executed last by pressing Control+T T or choosing in the menu.

Discover unit tests in solution
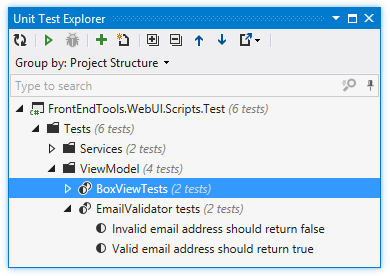
ReSharper adds the Unit Test Explorer window to Visual Studio ( or , or Control+Alt+T). Using this window, you can explore and run unit tests of all supported frameworks in the entire solution. Note that unit tests from a project only appear in the window after the project is built. Tests from currently opened files are updated automatically, new tests from the opened files appear in the unit test explorer as soon as you create them.
In the unit test explorer, you can:
Explore tests in the solution: browse all unit tests in a tree view, search tests and filter by a substring, regroup unit tests by project, namespace, and so on.
Navigate to source code of any test or test suite by double-clicking it in the view.
Run selected tests.
Create unit tests sessions from selected tests and test suites and/or add selected items to the current test session.

Run, debug, or cover unit tests in project or solution
You can run tests from the Unit Test Explorer , Solution Explorer, or Class View. Unit Test Explorer gives you the advantage to see only tests and test suites, while using other windows you need to know, which projects, files, and classes contain tests.
To execute tests from Unit Test Explorer, select the desired tests and click Run Unit Tests
.png) Control+T R on the toolbar.
Control+T R on the toolbar. To run tests from Solution Explorer or Class View, select one or more items (suites, files, folders, projects) that contain tests, and use the Run Unit Tests
.png) Control+T R commands, which are also available in the main menu () and in the context menu.
Control+T R commands, which are also available in the main menu () and in the context menu. To run all tests in solution, choose in the main menu or press Control+T L.
Whatever way you choose to run tests, you will see the execution progress, results, and output in the Unit Test Sessions window. If there is an open unit test session, the executed tests are added to that session. If there are no test sessions or the existing ones are locked, then a new tests session is created.
If necessary, you can always re-run the tests that you executed last by pressing Control+T T or choosing in the menu.
Using unit test sessions
You can group unit tests that target specific parts of your application into multiple unit test sessions. A unit test session can contain tests from different projects. You can have multiple test sessions and run them separately as needed. A single test/test suite can be included in several different test sessions.
For detailed instructions related to unit test sessions, see Unit test sessions.
Execution process
ReSharper provides several ways to execute unit tests. Whichever way you choose, execution progress, test results, and output are displayed in the Unit Test Sessions window, coverage results are shown in the Unit Test Coverage window.
As tests are running in a unit test session, the execution progress is shown in the status bar under the toolbar of the Unit Test Sessions window and the progress icon is displayed next to the currently executing test. You can run multiple unit test sessions simultaneously.
If necessary, you can enable the Track Running Test ![]() option on the toolbar. If it is on, the selection in the test tree switches automatically to the test that is currently running and the output panel always shows output of the current test during the execution.
option on the toolbar. If it is on, the selection in the test tree switches automatically to the test that is currently running and the output panel always shows output of the current test during the execution.
You can also enable the Auto Scroll Output When Running Test ![]() option to follow output of tests as they are running.
option to follow output of tests as they are running.

Analyze execution results and output
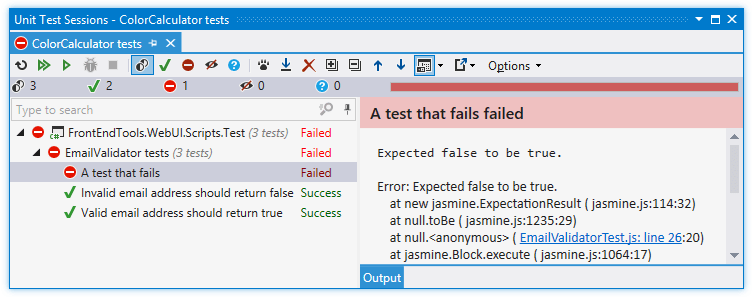
When the execution is over, the results are visualized in the Unit Test Sessions window.
The output pane (which you can place on the right or at the bottom using the Show Output ![]() button on the toolbar) displays output of the selected test. If the test is failed, ReSharper also adds short information on the failure and/or displays the stack trace of an exception. You can use clickable links in the output pane to navigate directly to types and methods involved with the failure. If the output displays a link to a file that does not belong to the solution, you can click this link to open the file in an external application associated with the corresponding file type or Ctrl-click to open it in Visual Studio.
button on the toolbar) displays output of the selected test. If the test is failed, ReSharper also adds short information on the failure and/or displays the stack trace of an exception. You can use clickable links in the output pane to navigate directly to types and methods involved with the failure. If the output displays a link to a file that does not belong to the solution, you can click this link to open the file in an external application associated with the corresponding file type or Ctrl-click to open it in Visual Studio.
By default, ReSharper wraps long lines in the output according to the current width of the output area. If necessary, you choose not to wrap long lines by clearing the Wrap long lines in Unit Test Session output checkbox on the page of ReSharper options .
Use the Group by selector on the toolbar to change grouping of the tests — you can either choose one of the predefined grouping modes in the upper part of the selector, such as Test Hierarchy, Project Structure, and so on, or use the lower part of the selector to choose a custom set of grouping properties.
On the status bar, you can see the total number of tests in the session as well as number of tests in different states:
![]()
By default, tests in all states are shown, but you can click the corresponding icons to filter tests by their state. You can also Ctrl-click several icons to display tests in several different states.
Status of each test in the Unit Test Sessions window is displayed with one of the following icons:
| Unit test is currently executing |
| Unit test is scheduled for execution in the current run |
| Unit test was not executed |
| Unit test passed in the lats test run |
| Unit test failed in the lats test run |
| Unit test was aborted in the last test run |
| Unit test was started but ReSharper could not read the test runner output. This normally happens when you abort test execution, but could also be a sign of an error occurring in the test runner. |
The same icons are used to display status of grouping items (suites, projects, and so on)
The icons are also used on each session's tab to display the overall execution result of the sessions.
The corresponding icons above the test session tree show how many tests are in each of the states. The ![]() icon shows the total number of tests in the session.
icon shows the total number of tests in the session.
Using these icons, you can filter the tree so that only tests in the corresponding status are displayed.