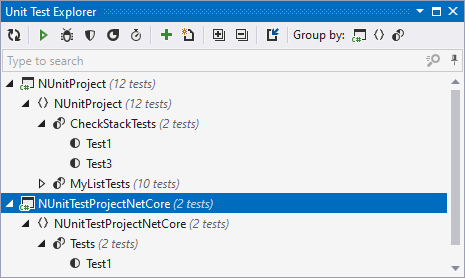
Unit Test Explorer window
Using this window, you can explore and run or debug unit tests of all supported frameworks in the entire solution. Note that unit tests from a project only appear in the window after the project is built. Tests from currently opened files are updated automatically, new tests from the opened files appear in the unit test explorer as soon as you create them. For more information, see work with unit tests in project or solution.
To search tests, start typing a test name or its CamelHumps abbreviation as soon as your focus is in this window.

Toolbar Controls
Control | Name | Description |
|---|---|---|
| Refresh | Updates window content to reflect any changes made in the code or externally. |
| Run Unit Tests Control | Runs selected tests. To select multiple tests, click them holding the Ctrl key. |
| Debug Unit Tests Control | Starts debugging for selected tests in the current session. |
| Cover Unit Tests Control | By clicking this button, you can start code coverage of the selected tests. This button appears if JetBrains dotCover is integrated with Visual Studio. |
| Profile Unit Tests | By clicking this button, you can profile selected tests. This button appears if JetBrains dotTrace is integrated with Visual Studio. |
| Run Unit Tests under dotMemory Unit Control | Runs selected tests with dotMemory Unit enabled. Use this button to run tests that use dotMemory Unit framework to check code for memory issues. |
| Append Tests to Session Control | Click this button to add the selected tests to a test session. ReSharper will suggest choosing one of the existing sessions or creating a new one. |
| Create New Session Control | Creates a new test session with selected tests, which is then opened in the Unit Test Sessions window. |
| Import Session | Click to open a test session that you have previously saved in a .testsession file. |
| Expand All/Collapse All | Expands/collapses all nodes in the current tab. |
Group by | Allows grouping items in the window by different categories. |