Settings

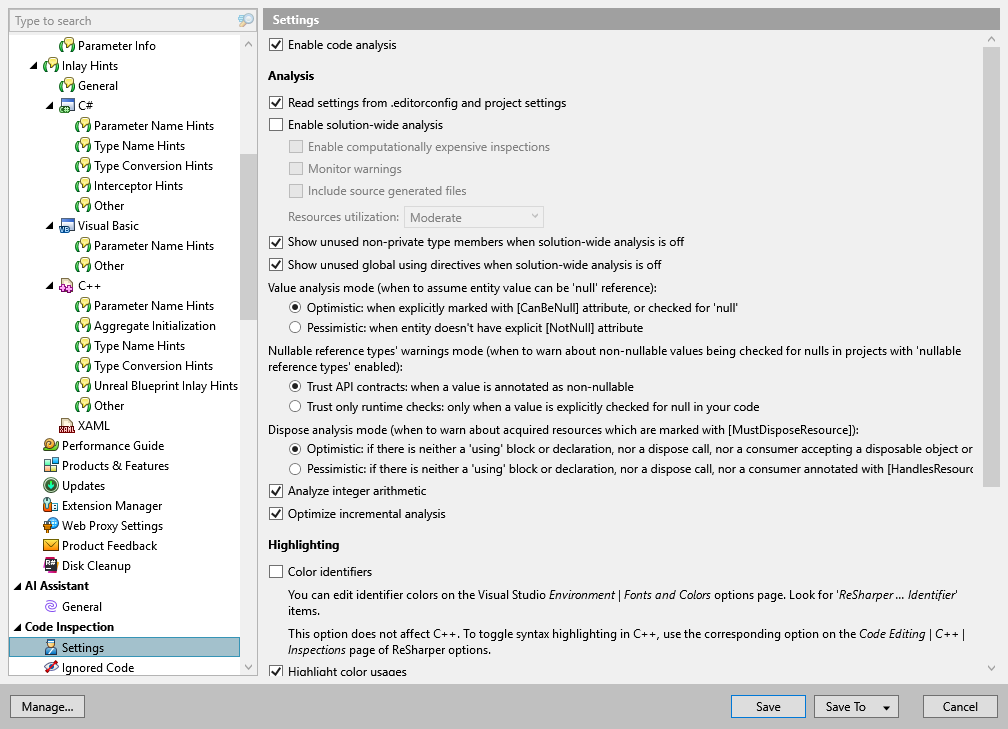
In this page of ReSharper options, you can specify your preferences for code inspection.
Enable code analysis | Select this checkbox to enable design-time code inspection. Regardless of this checkbox, you can always run code inspection in specific scope. |
Analysis
Read settings from editorconfig and project settings | If you use EditorConfig to maintain code styles for your project, you can also configure code inspections from .editorconfig files. If this checkbox is enabled, you can configure code inspection severity levels and C# naming styles right from .editorconfig files. |
Enable solution-wide analysis | Enables solution-wide analysis (including solution-wide code inspections), which is disabled by default. Note that in large solutions, solution-wide analysis may result in some performance degradation. However, there are several ways to improve the performance of solution-wide analysis. |
Enable computationally expensive inspections | Turns on the data-flow analysis and brings additional inspections, for example, to calculate nullability. |
Monitor warnings | Enables warnings in solution-wide analysis. When warnings are enabled in solution-wide analysis, it works as follows: as long as there are errors in the solution, only errors will be displayed; unresolved warnings will only appear when the last error is fixed. When warnings are disabled, the status bar indicator will turn green as soon as the last error is fixed. When this option is enabled, you can click |
Include source generated files | Use this checkbox to choose whether to monitor source generated files. |
Resources utilization | Use this selector to define how solution-wide analysis should use system resources. Low means low resource usage, but longer analysis time. High means less time spent on initial analysis on multiple-core machines. |
Show unused non-private type members when solution-wide analysis is off | When this option is enabled, ReSharper will detect all unused non-private members even if solution-wide analysis is disabled. This option does not have any significant performance impact on small- and medium-sized solutions. However, you may want to disable it if you experience performance problems in a large solution or when working with very large source files. |
Show unused global using directives when solution-wide analysis is off | When this option is enabled, ReSharper will report all However, you may want to disable it if you experience performance problems in a large solution. |
Value analysis mode | Using the value analysis, ReSharper finds out which entities can hold null value and highlights possible errors with null dereference. You can choose one of the following modes.
|
Nullable reference types' warnings mode | If nullable reference types (NRT) are enabled, ReSharper reuses the results of C# compiler analysis. NRT improve overall precision of the nullability analysis, but there are cases when NRT contracts can be violated, for example, when values are coming from code without For more information, refer to Nullable reference types. |
Dispose analysis mode | Choose one of the modes of the dispose analysis. When you receive an object via a [MustDisposeResource] API, ReSharper will always consider it disposed and issue no warnings if you wrap the corresponding variable in a If instead you pass the disposable variable as an argument to a method, ReSharper will issue warnings depending on the analysis mode:
|
Analyze integer arithmetic | Use this checkbox to enable or disable the analysis of integer values (integral arithmetics). |
Optimize incremental analysis | When turned on, full file rehighlighting tracks which members were inspected and does not reanalyze them if modifications only change other members within a file |
Highlighting
Color identifiers | This option lets you enable or disable ReSharper syntax highlighting scheme. If it is selected, language identifiers are highlighted with colors as defined in Visual Studio options: . The list of syntax identifiers provided by ReSharper is available in the Display items list, each name starting with the ReSharper prefix. Note that by disabling this option you also disable symbol information tooltips that appear on mouse over. |
Highlight color usages | Enables highlighting of color definitions in code. For more information, refer to Color assistance. |
Highlight special characters in string literals | Enables highlighting of correct and incorrect escape sequences in non-verbatim strings. For example: |
Highlight captured primary parameters | When this option is enabled, ReSharper changes syntax highlighting of primary constructor parameters that are used in instance members. Such parameters become captured in the instance context and behave like instance fields, therefore it is convenient to have them syntactically highlighted as fields. In the example below, the
 |
Caret-dependent highlighting
Highlight usages of the element under the cursor | By default, when you set a caret at a declaration or a usage of a variable or a member, all other usages of that symbol in the file are displayed with a background highlighting. Use this checkbox to toggle this behavior. |
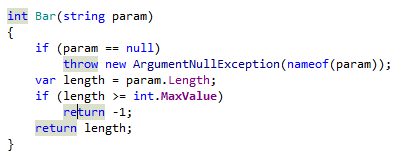
Highlight context exits | This option, which is enabled by default, tells ReSharper to highlight all places where the control flow can exit the current context. For example, for a method, it will highlight the return type of the method, all  For a loop or a Note that if a method is not entirely visible in the editor, you can invoke the Navigate To: Function Exits command on the method name to trigger another kind of highlighting, which will not disappear when your caret leaves the method name. |
Highlight related async/await keywords | This option enables highlighting of all |
Highlight condition elements | This option enables highlighting of matching logical and conditional operators ( In the example below, %product helps understand that the highlighted operators will be evaluated together, while the  |
Quick fixes and context actions
Use parallel code analysis when applying fixes/actions in scope | |
Use solution-wide analysis results when applying quick fixes in scope |