Unity Engine settings
C#
Show gutter icons for implicit script usages | Use this option to choose when to show the Unity gutter icon for classes, methods, and fields that are implicitly used by Unity: |
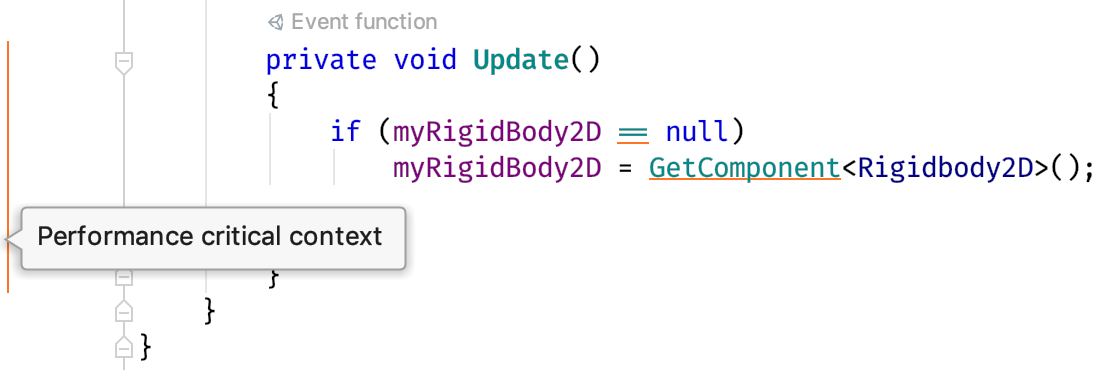
Enable performance analysis in frequently called code | When this option is enabled, ReSharper shows you performance sensitive areas: event functions that are called each frame, such as |
Highlight performance critical contexts: | Unity has a number of methods that get called very frequently. These methods are treated as a performance-critical context and can be highlighted in the editor gutter. You can choose to highlight all such areas or only the current method to reduce the visual noise.  |
Show gutter icons for frequently called methods | When this option is enabled, you will see the following gutter indicators next to frequently called methods: |
Enable analysis for Burst compiler issues | |
Show gutter icons for Burst compiled called methods |
Dots
Exclude DOTS-generated code from navigation results |
Refactoring
Ask whether to add 'FormerlySerializedAs' when renaming serialized fields | |
Add 'FormerlySerializedAs' when renaming serialized fields |
Text Based Assets
Parse text-based asset files for script and event handler usages | |
Cache prefab data to improve Find Usages performance | |
Automatically disable asset indexing for large solutions |
Shaders
Suppress resolve errors of unqualified names |

