Unity Engine settings
ReSharper | Options | Code Editing | Unity Engine
Show gutter icons for implicit script usages | Use this option to choose when to show the Unity gutter icon for classes, methods, and fields that are implicitly used by Unity: |
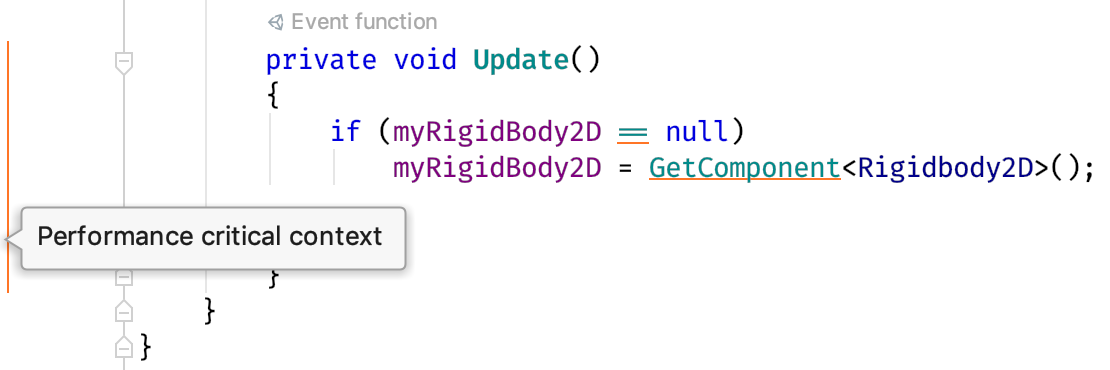
Enable performance analysis in frequently called code | When this option is enabled, ReSharper shows you performance sensitive areas: event functions that are called each frame, such as |
Highlight performance critical contexts: | Unity has a number of methods that get called very frequently. These methods are treated as a performance-critical context and can be highlighted in the editor gutter. You can choose to highlight all such areas or only the current method to reduce the visual noise.  |
Show gutter icons for frequently called methods | When this option is enabled, you will see the following gutter indicators next to frequently called methods: |
Enable analysis for Burst compiler issues | |
Show gutter icons for Burst compiled called methods |

