Basic Operations with Issues

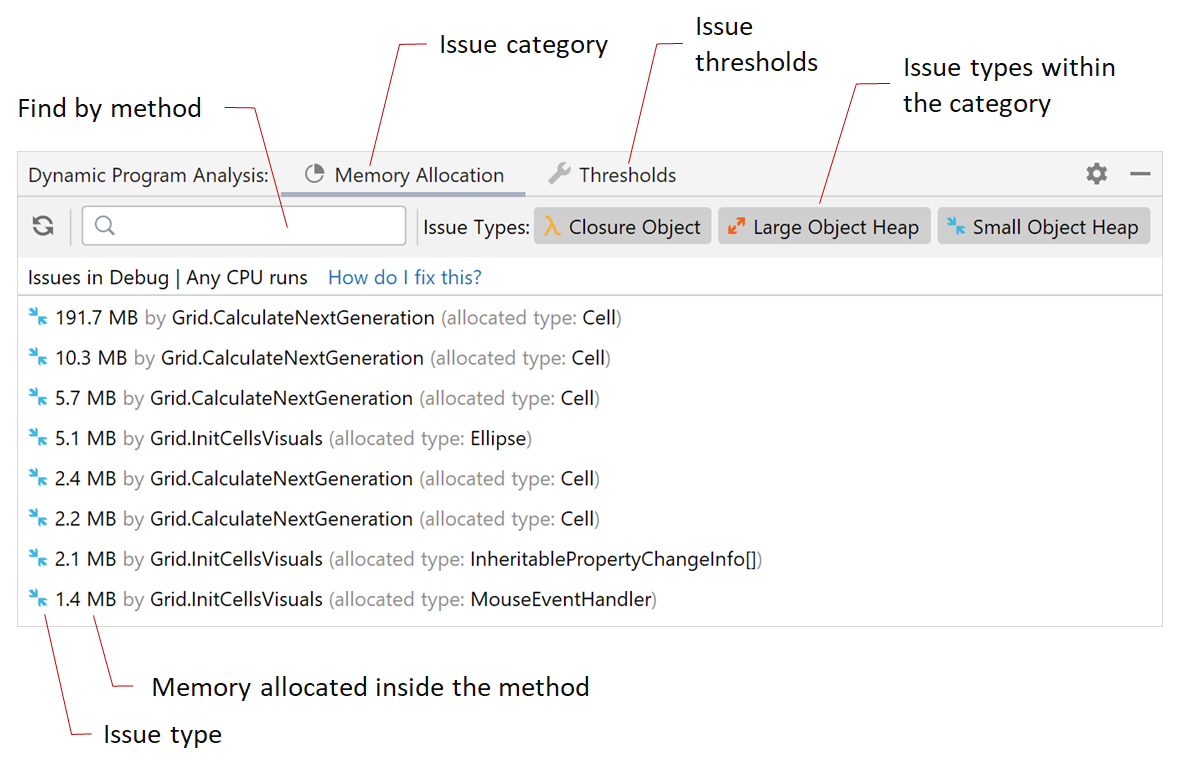
After you run or debug your project, DPA shows the list of found issues in the Dynamic Program Analysis window.
Open issue list
To open the list of found issues, do one of the following:
Use the menu .
Click the DPA icon
 in the status bar and select View Issues.
Search and filter
By default, all types of issues are shown in the list. To filter issues by type, use buttons in the window toolbar.

To find a method in the list of issues, use the search field in the toolbar.

Navigate
To navigate from a method in the list to its source code:
Select the method in the list.
Press F4 or in the context menu, choose Navigate to Method.
Place the caret at the line and press Alt+Enter.
In the menu, choose View memory allocation issues.

View stack trace
To view the issue stack trace:
Select the issue (method) in the list.
Do one of the following:
Double-click the issue.
In the context menu, choose Show stacktrace.
The stack trace will be shown in the Stacktrace window.
Share
To copy issue details:
Select the issue (method) in the list.
Do one of the following:
In the context menu, choose Copy Details. This will copy issue details (size, type, and method name) to the clipboard.
In the context menu, choose Copy Details and Stack Trace. This will copy issue details and the method's stack trace to the clipboard.
Remove
To remove an issue from the list until next run, select the issue and mark it as fixed.
To remove an issue from the list permanently, do one of the following: