Debug Multithreaded Applications
Multithreaded applications are always harder to debug as you have to track multiple threads at a time. Moreover, multithreaded applications introduce new types of bugs and performance issues like uneven workload distribution, lock contention, serialized execution, and other*.
The illusion of a sequential flow you get from stepping in a debug session does not help while debugging a multithreaded app and can be misleading. When investigating issues that can be concurrency bugs, you should rely more on breakpoints rather than on sequential stepping. For example, conditional breakpoints can help you a lot if you want to focus on just one thread: just use some unique property of your thread (for example thread ID) to trigger the breakpoint; data breakpoints will break the execution when a marked property of a specific object changes by any thread.
JetBrains Rider provides the following functionality to simplify the debugging of multithreaded applications:
Threads pane on the left shows all threads of the application.
Frames view on the right lists all stack frames of the selected thread.

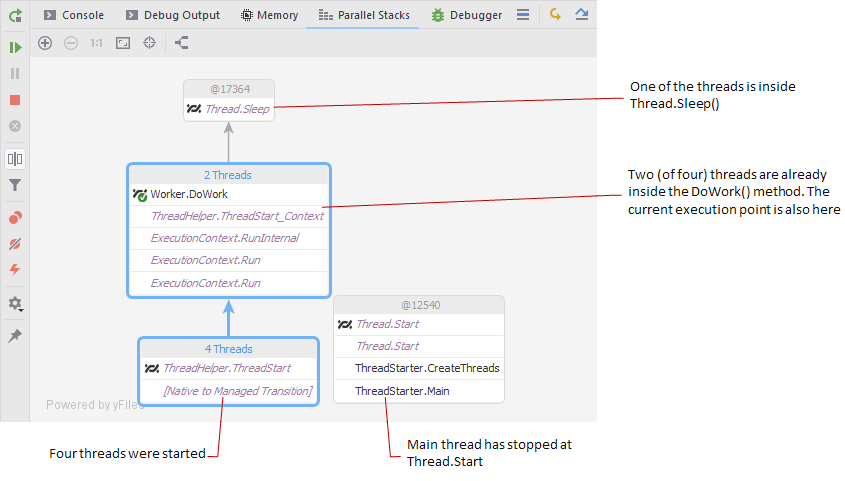
Parallel Stacks pane simplifies threads analysis by showing threads and their stack frames on the diagram. See details below in this section.
Parallel Stacks
The Parallel Stacks pane lets you quickly observe all threads in your application and quickly navigate between them and their stack frames.
For example, let's take a look at how Parallel Stacks look like during the debugging of a simple application that starts a number of threads. Each thread does nothing but sleeps for one second via Thread.Sleep(1000). Let's imagine, we've put a breakpoint at this Thread.Sleep(1000) call and stopped on fourth breakpoint hit: four threads were created up to that moment.

Here are some notes to the image:
The call path of the current thread is highlighted blue.
 indicates the execution point of the current thread.
 near a method indicates that a thread has stopped on this method.