Profile Unit Tests
Along with applications, dotTrace lets you profile unit tests. The profiling workflow looks as follows:
Step 1. Configuring a profiling session

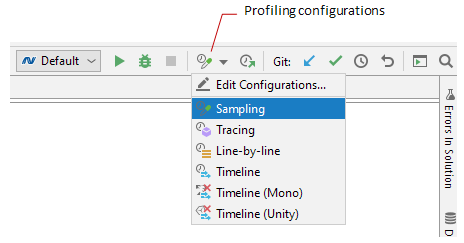
Before starting a profiling session, you must select a profiling configuration:
The profiling configuration specifies profiling session settings like which profiling type will be used, whether child processes must be profiled, and so on.
The profiling target is a unit test runner that runs selected tests.
Select a profiling configuration
In the toolbar, in the list of profiling configurations, select:
either one of the predefined configurations: Sampling, Tracing, Line-by-line, Timeline, Timeline (Mono) (for Mono apps), Timeline (Unity) (for Unity apps).
or your own custom configuration.
Create a profiling configuration
On the toolbar, in the list of profiling configurations, select Edit Configurations...
In the opened Profiling Configurations window, click
 to add a new profiling configuration.
- In the list, select one of the profiling types:
Sampling Accurate time measurement, number of calls is not measured. Recommended for most cases. Ideal when you look for performance issues in your app for the first time.
On macOS and Linux, if you want to profile an application targeting .NET Core 3.0 or earlier, select Sampling (.NET Core 3.0 or earlier). Note that because of .NET Core limitations, you might have issues: the profiled application may hang or crash. Projects targeting .NET Core 3.1 (or later) can be profiled without any issues.
Tracing Accurate calls count measurement, time measurement may be inaccurate due to profiling overhead. When sampling data is not enough. For example, for analyzing algorithm complexity (when info about number of calls is more valuable than call time values). Line-by-line Each line of code is measured, call time values are inaccurate due to huge profiler overhead. For advanced use cases only. For example, when you already know what function causes issues and want to analyze each line of it. Timeline Collects temporal data about thread states, application events, and other multi-threading data. Based on Event Tracing for Windows (ETW). Recommended for most cases. Especially, for analyzing multithreaded apps. Use it, for example, to determine the cause of UI freezes, excessive garbage collections, uneven workload distribution, insufficient I/O, and so on.
If you want to create a configuration for profiling Mono or Unity applications, select Timeline (Mono) or Timeline (Unity) correspondingly.
Specify configuration Name and other profiling options:
Control profiling manually
Enables you to control profiling manually via the profiler controls. For example, to take a snapshot, you will have to click Get Snapshot.Collect profiling data from start: This setting is ignored when profiling unit tests.
Control profiling via API
Enables you to control profiling directly from the code of the profiled application. For example, to take a snapshot in the exact point of your code. Learn more about using the API in the dotTrace documentation.Profile child processes
If selected, dotTrace will profile not only the main app process but the processes it runs as well.Time measurement
This option defines how dotTrace must calculate calls time. Typically, this is a choice between whether dotTrace should calculate time when a thread is not working or should not. For more details, refer to dotTrace documentation.Real time (performance counter) Recommended. dotTrace calculates the overall real time passed between method entry and exit. This time does not depend on app threads states. Time is calculated using system performance counter. Real time (CPU instruction) dotTrace calculates the overall real time passed between method entry and exit. This time does not depend on app threads states. Time is calculated using the CPU register. Thread time dotTrace calculates only the time when a certain thread is running. The time when the thread is waiting or sleeping is not included in calculation. Thread cycle time dotTrace calculates only the time when a certain thread is running. The time when the thread is waiting or sleeping is not included in calculation. Time is calculated using the CPU register. The table next in this section will help you to choose a time measurement method better suitable for your case.
- Enable inlining
(Tracing, Line-by-line) Clear this option if you want dotTrace to turn off JIT-inlining and get call stacks that closely resemble the structure of application's source code.
- High accuracy
(Tracing, Line-by-line) If selected, dotTrace will take into account time spent in profiler itself by taking more time samples.
- Enable native profiling
(Timeline, Unity/Mono on Windows) If selected, dotTrace will collect native call stack data. The resulting snapshot will contain both managed and native call stacks. This profiling option may be helpful for finding performance issues in Unity games.
- Collect native allocations
(Timeline) If selected, dotTrace will collect information about all memory allocations the profiled application does in the native (unmanaged) heap. To be able to select this option, you must have Windows Performance Toolkit installed on your computer.
- Collect debug output
(Timeline) If selected, dotTrace will collect information about all messages the profiled application sends to the debug output.
- Collect TPL events
If selected, profiling performance may be affected but dotTrace will collect Task Parallel Library (TPL) data. If cleared, there will be no
Tasknodes in Call Tree andasynccall nodes will be shown without their await and continuations parts.Clear this option in case your application does not use multitasking or you do not need this info.
Step 2. Running the session and getting snapshots
Start a session and get snapshots
Do one of the following:
Open the Unit Tests window, select unit tests you want to profile, and click the
 Profile Unit Tests button or select in the main menu.
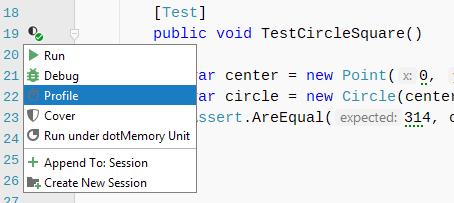
In the code editor, open the menu in the gutter for a desired unit test or test class and select Profile.

Once the profiling is started, you will see the Performance Profiler tool window opened on the Profiling tab with the profiling controller inside.
When profiling unit tests, you don't have to manually control the profiling session (get snapshots and finish the session). dotTrace will automatically take a performance snapshot once a unit test session is over. The collected snapshot will be added to the list of snapshots inside the Performance Profiler window.
Step 3. Analyzing collected snapshots
For more details on how to analyze performance snapshots, refer to Analyze Profiling Results.
Analyze a snapshot
On the All Snapshots tab of the Performance Profiler tool window, select the snapshot you want to analyze.
Analyze the collected data using one of the views:
Call Tree: a "classic" call tree that shows you all method calls in all threads. Each top-level node represents a top-level function which was executed by a certain thread. Use this view to quickly get down to actual application activity. Learn more
Top Methods: the best place to start when analyzing application performance. It is a simple plain list of methods with the highest execution time. Note that you can reduce the system functions "noise" by excluding them from the list using the
 toggle: if enabled, method's execution time is calculated as a sum of method's own time and the time of all child system methods (down to the next user method in the stack). Learn more
Once the suspicious method is found, press F4 or select Jump to Source from the context menu. Rider will navigate you right to the method's source code.