Run/Debug Configuration: .NET Launch Settings Profile
This run/debug configuration type helps you run and debug .NET Core/ASP.NET Core applications that have their launch settings configured in a launchSettings.json file.
What is launchSettings.json
launchSettings.json, which is placed in the Properties folder of a project, describes how the application can be launched — the command to execute, whether the browser should be opened, which environment variables should be set, and so on. This information can then be used by JetBrains Rider, by dotnet run, or by any other tool to run or debug the application.
This article details the conventions used in launchSettings.json. The example below shows a sample launchSettings.json with two launch profiles: IIS Express and Sample.
Create run/debug configurations based on launchSettings.json
When you open a project with launchSettings.json for the first time, JetBrains Rider will pick the available launch profiles and automatically create corresponding run/debug configurations, which you can then use to run and debug the project.
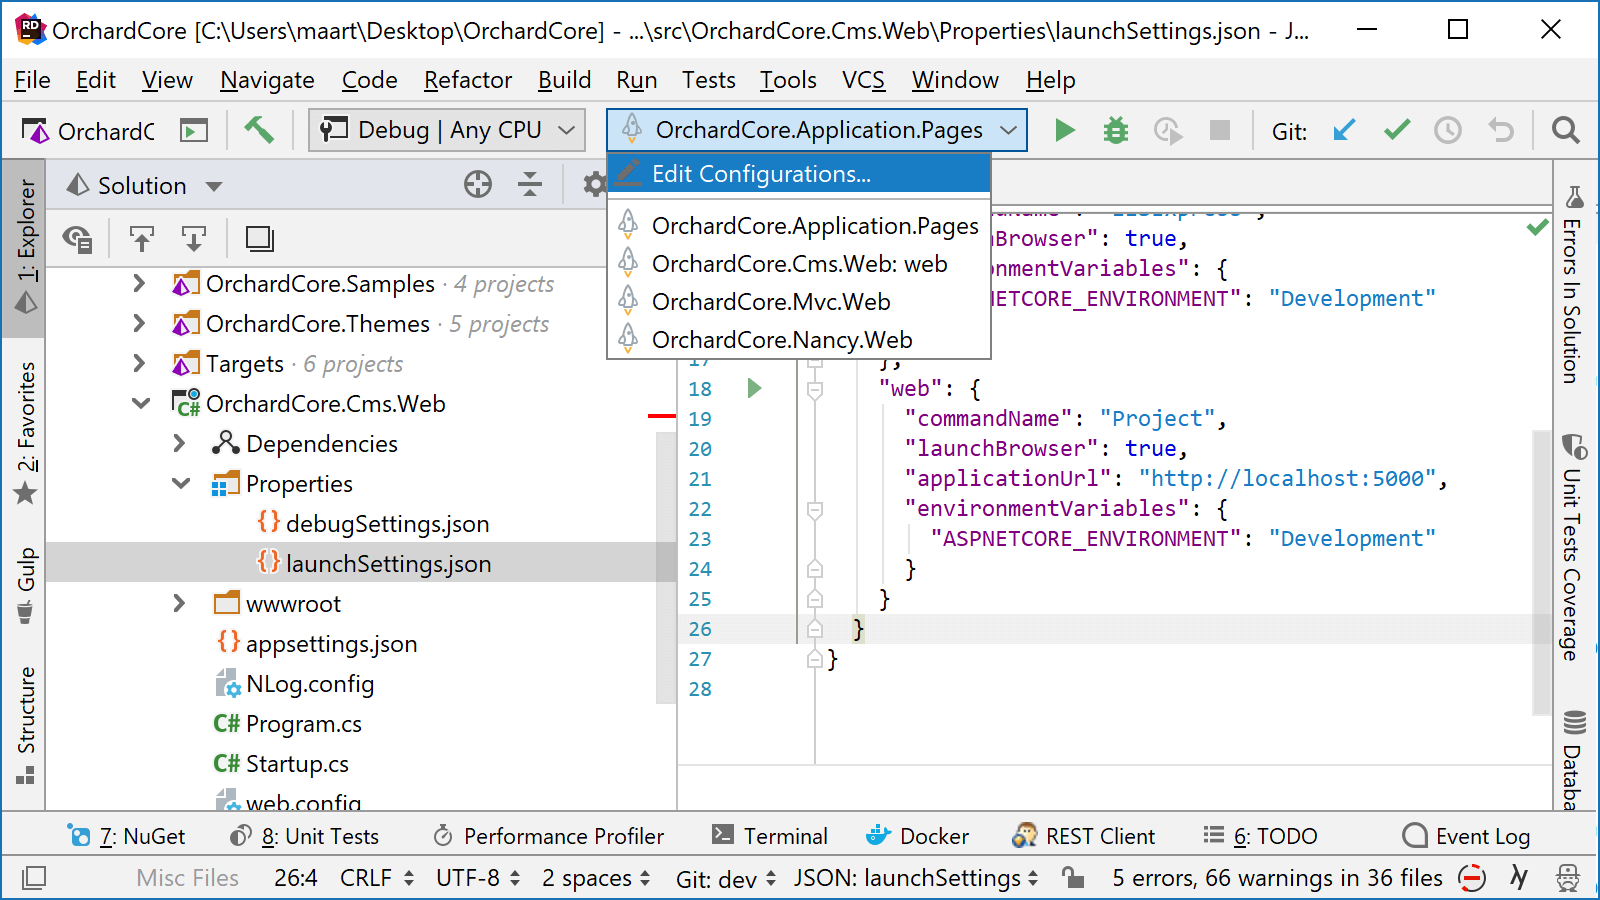
For example, after cloning and opening the Orchard CMS, JetBrains Rider will create the following run/debug configurations from the launchSettings.json files:

JetBrains Rider only generates run/debug configurations automatically when no user-defined run configurations were created in the solution before. If there are existing run/debug configurations, you can right-click launchSettings.json in the Solution Explorer and choose Generate Configurations to import the project's launch profiles into run/debug configurations.
If you remove all run/debug configurations from the solution and reopen it, JetBrains Rider will generate new run/debug configurations based on launch profiles in launchSettings.json.
Run and debug launch profiles
When launch profiles are imported as run/debug configurations, you can choose the corresponding configuration on the toolbar and click Run ![]() or Debug
or Debug ![]() :
:

If a project has launchSettings.json, but there are no corresponding run/debug configurations for some reason, you can right-click the project in the Solution Explorer and choose Run '...' or Debug '...'. In this case, JetBrains Rider will create a temporary run/debug configuration for the first launch profile in the project's launchSettings.json and execute it.
You can also open a launchSettings.json in the editor and use the gutter icons to run or debug any launch profile:

In this case, JetBrains Rider will also create a temporary run/debug configuration for this profile.
Edit launch settings profiles
A run/debug configurations based on a launch profile includes two kinds of parameters:
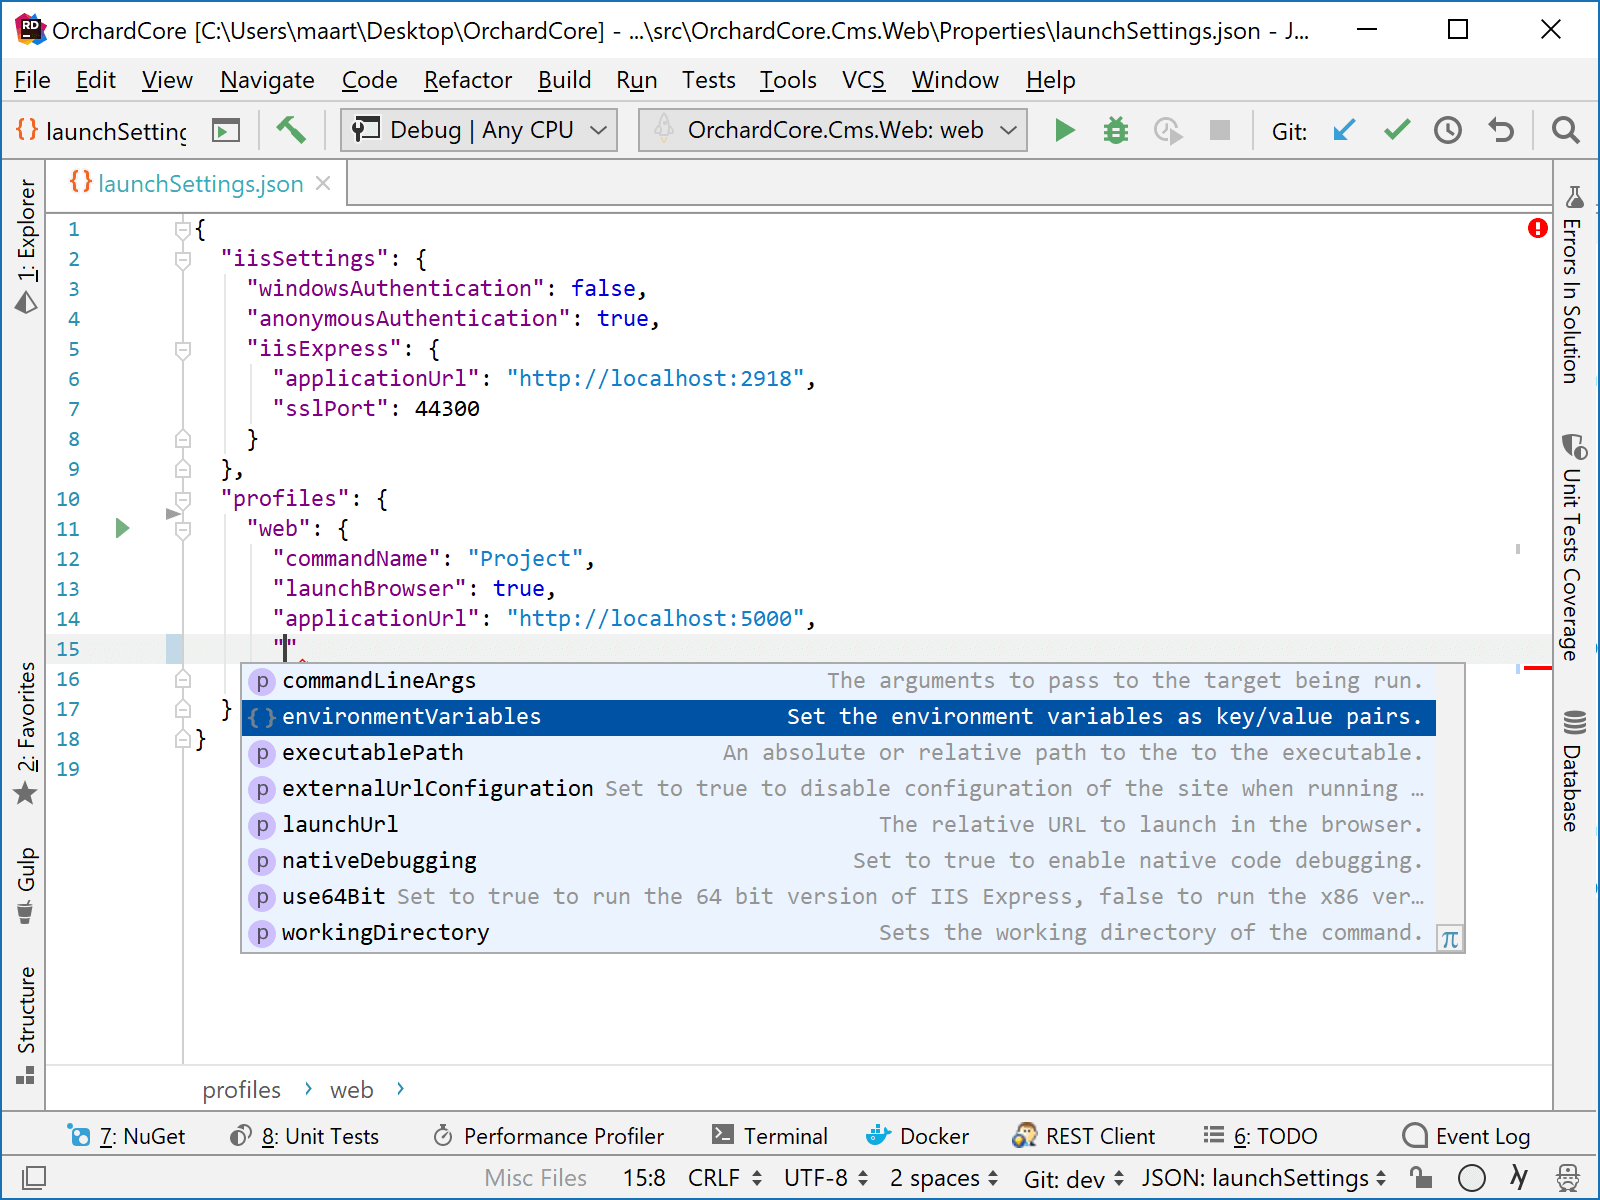
Parameters from launchSettings.json, which you can configure by editing the file — use syntax highlighting, code analysis, and code completion when editing:

Additional configuration parameters added by JetBrains Rider, such as the target framework to use or .NET runtime arguments. To configure these parameters, choose from the menu and pick the corresponding configuration.
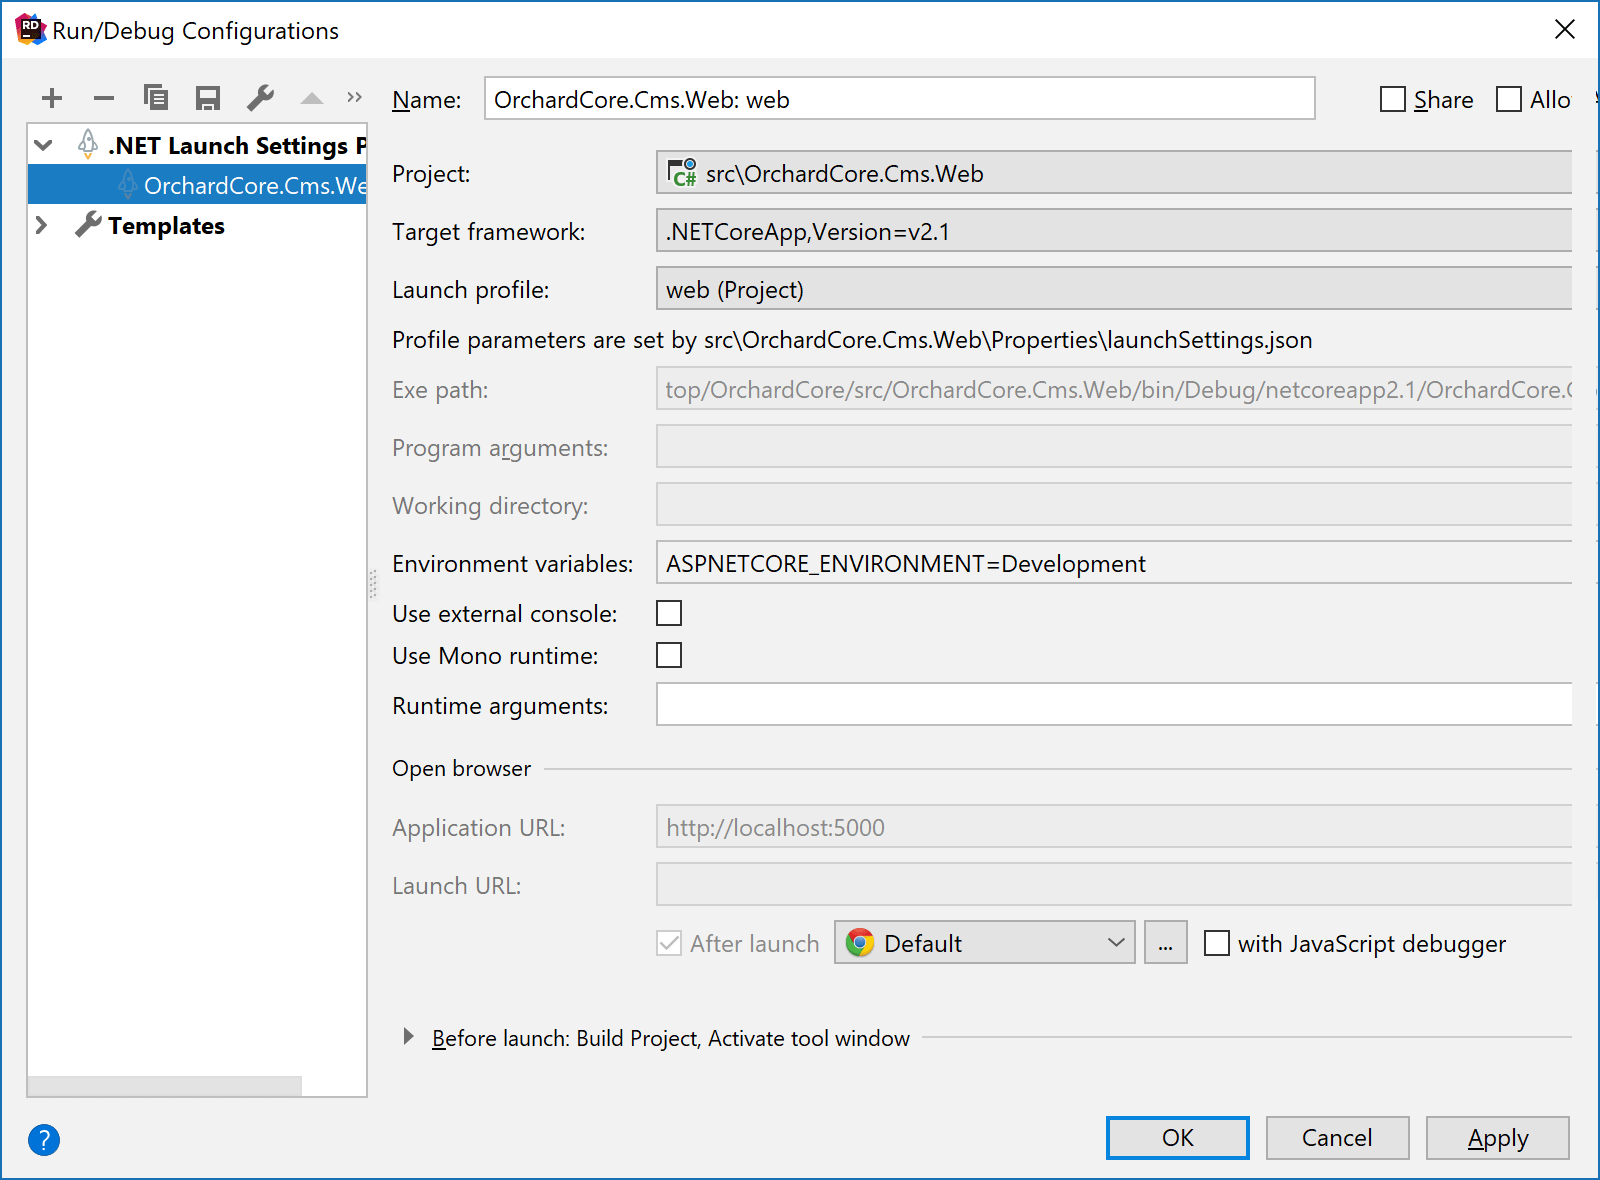
Parameters from launchSettings.json are shown as read-only; all other parameters are editable:
Main options
| Project: | Choose a startup project for this configuration. |
| Target framework: | A .NET Framework version that will be used to run this configuration. |
| Launch profile: | Use this selector to pick one of the profiles configured in the launchSettings.json file. |
| Exe path: | The path to the executable file of the selected target project is calculated automatically, but you can change it if needed. |
| Program arguments: | Arguments that will be passed to the executable when the configuration is started. Multiple arguments should be separated with whitespaces. For some project types (for example, Web Application), JetBrains Rider will fill this field automatically so that the target project could be started correctly. |
| Working directory: | The working directory is automatically set to the bin/Debug path of the selected target project, but you can change it if needed. |
| Environmental variables: | Here you can specify custom environment variables for the target executable. |
| Runtime variables: | Both dotnet and Mono support setting custom runtime arguments when launching an application. For example Mono supports many runtime arguments to customize how your application is run. You can select the garbage collector to be used (--gc=boehm or --gc=sgen), on macOS you can select the runtime architecture to be used (--arch=32 or --arch=64), and more. |
| Use mono runtime | If you are working on Windows, you can check how your application works with the mono runtime. JetBrains Rider will use the mono executable specified on the page of JetBrains Rider settings Ctrl+Alt+S. To debug with mono runtime, you need:
|
| Use external console: | By default, the output of .NET Core and Mono applications is shown in the Run or Debug window. Use this checkbox to show the output in an external window. This checkbox does not affect classic .NET application types (for example, .NET Console Application) — their output in always shown in an external window. |
| The following four options are available when a IIS Express launch profile is chosen in the Launch profile: selector. | |
| Generate applicationhost.config | To launch IIS Express with your ASP.NET Core application, JetBrains Rider uses a configuration file .idea/config/applicationhost.config, which is created using a template that ships with IIS Express. When possible, customizations you make to this file are also preserved. You might want to disable this option for heavy customizations. |
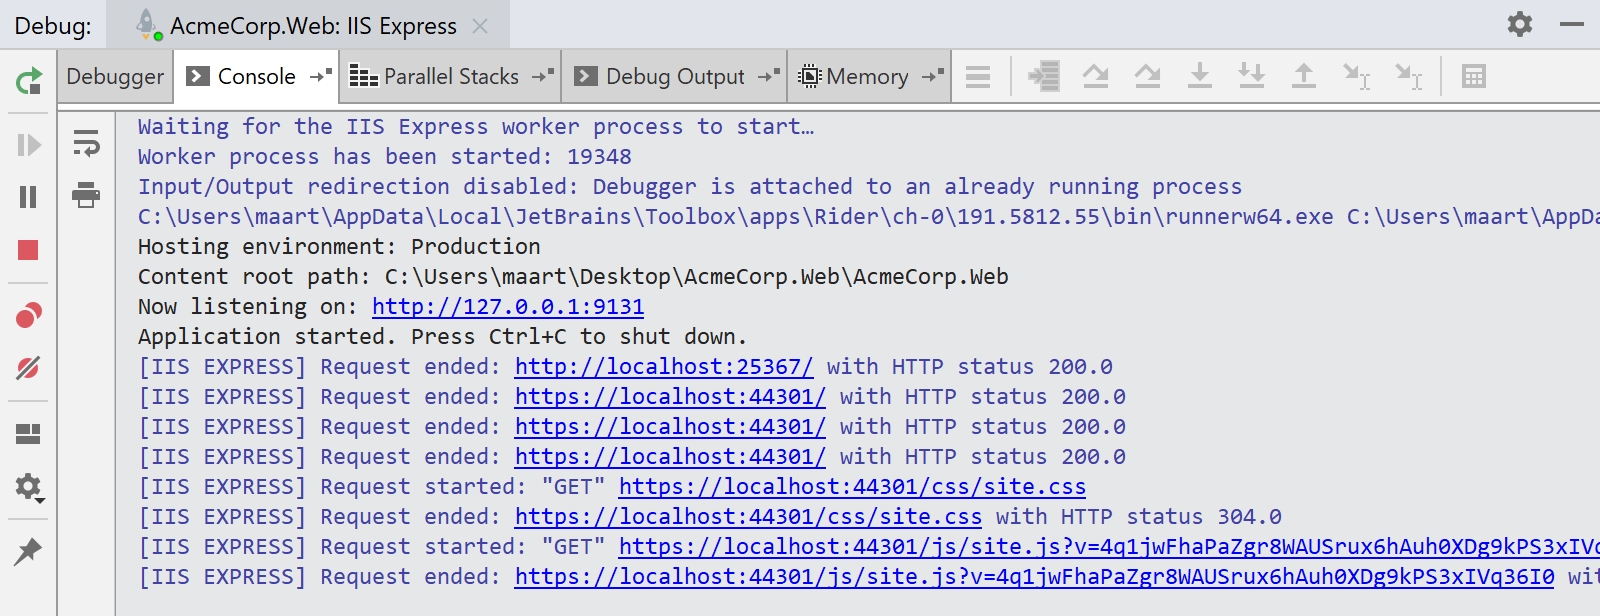
| Show IIS Express output | This option enables output from the IIS Express process. By default, it is disabled (as the output is quite verbose), but when enabled we can see additional details when running the application:  |
| Send debug request | When this option is enabled, JetBrains Rider will send an initial request (with a DEBUG HTTP request method) to the target ASP.NET Core application. This ensures the application is started and the debugger is attached, even when the browser is not started. |
| Additional IIS Express arguments | This field lets you pass additional arguments to the IIS Express host (for example, to enable request tracing). |
Common
When you edit a run configuration (but not a run configuration template), you can specify the following options:
Item | Description |
|---|---|
Name | Specify a name for the run/debug configuration to quickly identify it when editing or running the configuration, for example, from the Run popup Alt+Shift+F10. |
Allow parallel run | Select to allow running multiple instances of this run configuration in parallel. By default, it is disabled, and when you start this configuration while another instance is still running, JetBrains Rider suggests to stop the running instance and start another one. This is helpful when a run/debug configuration consumes a lot of resources and there is no good reason to run multiple instances. |
Store as project file | Save the file with the run configuration settings to share it with other team members. The default location is .idea/runConfigurations. However, if you do not want to share the .idea directory, you can save the configuration to any other directory within the project. By default, it is disabled, and JetBrains Rider stores run configuration settings in .idea/workspace.xml. |
Toolbar
The tree view of run/debug configurations has a toolbar that helps you manage configurations available in your solution as well as adjust default configurations templates.
| Item | Shortcut | Description |
|---|---|---|
| Alt+Insert | Create a run/debug configuration. | |
| Alt+Delete | Delete the selected run/debug configuration. Note that you cannot delete default configurations. | |
| Ctrl+D | Create a copy of the selected run/debug configuration. Note that you create copies of default configurations. | |
| The button is displayed only when you select a temporary configuration. Click this button to save a temporary configuration as permanent. | ||
| View and edit the template (that is, the default run/debug configuration settings). The templates are displayed under the Templates node and used for newly created configurations. | ||
| Alt+Up/ Alt+Down | Move the selected run/debug configuration up and down in the list. The order of configurations in the list defines the order, in which the configurations appear when you choose a run/debug configuration. Default templates of run/debug configurations are always sorted alphabetically. | |
Move into new folder / Create new folder. You can group run/debug configurations by placing them into folders. To create a folder, select the configurations within a category, click Then, to move a configuration into a folder, between the folders or out of a folder, use drag or To remove grouping, select a folder and click | ||
| Click this button to sort configurations in the alphabetical order. |
Before Launch
In this area, you can specify tasks to be performed before starting the selected run/debug configuration. The tasks are performed in the order they appear in the list.
| Item | Shortcut | Description |
|---|---|---|
| Alt+Insert | Click this icon to add one of the following available tasks:
| |
| Alt+Delete | Click this icon to remove the selected task from the list. | |
| Enter | Click this icon to edit the selected task. Make the necessary changes in the dialog that opens. | |
| Alt+Up/ Alt+Down | Click these icons to move the selected task one line up or down in the list. The tasks are performed in the order that they appear in the list. | |
| Show this page | Select this checkbox to show the run/debug configuration settings prior to actually starting the run/debug configuration. | |
| Activate tool window | By default this checkbox is selected and the Run or the Debug tool window opens when you start the run/debug configuration. Otherwise, if the checkbox is cleared, the tool window is hidden. However, when the configuration is running, you can open the corresponding tool window for it yourself by pressing Alt+4 or Alt+5. |