Run/Debug Configuration: .NET Static Method
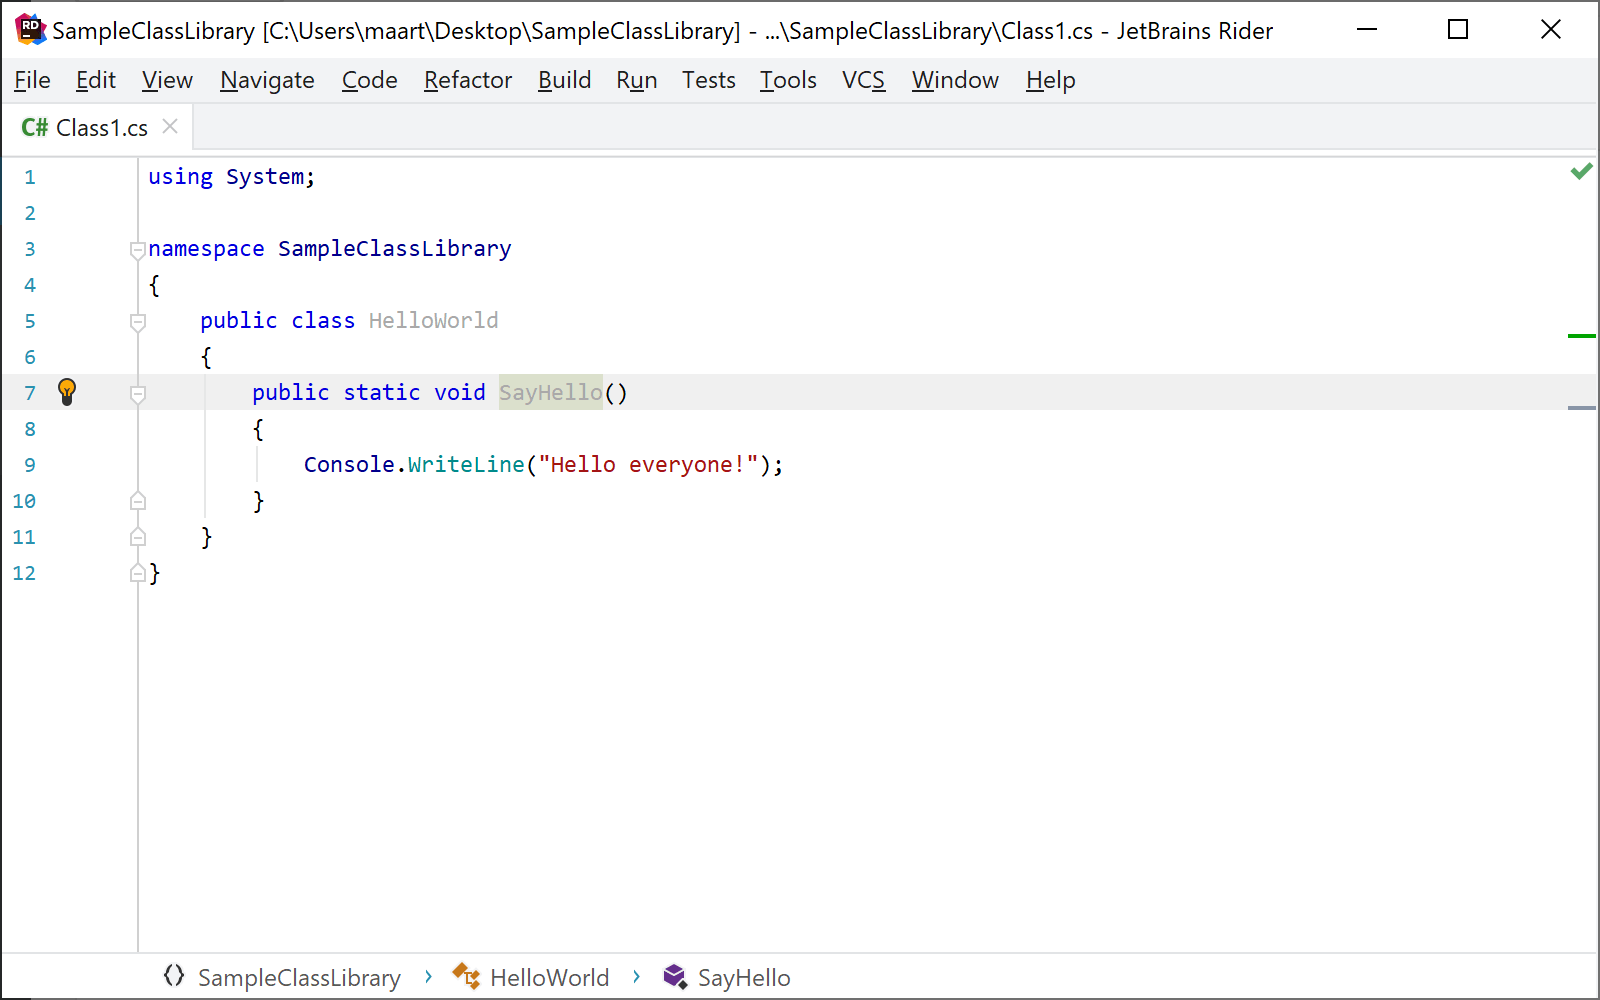
This configuration type lets you run or debug any public static method without parameters. You can use this type of configuration for a static method to run or debug any algorithm or subsystem in your codebase. If necessary, you can use console for interactive execution.
Instead of creating a configuration of this kind manually, you can run any public static void method from the editor, and the temporary configuration will be created automatically.

| Project: | Choose a project where the target static method is located. |
| Target framework: | A .NET Framework version that will be used to run this configuration. |
| Static method: | Provide the full name of the method (that is, Project.Class.Method) |
| Working directory: | The working directory is automatically set to the bin/debug path of the selected target project, but you can change it if needed. |
| Environmental variables: | Here you can specify custom environment variables for the target executable. |
| Runtime variables: | Both dotnet and Mono support setting custom runtime arguments when launching an application. For example Mono supports many runtime arguments to customize how your application is run. You can select the garbage collector to be used (--gc=boehm or --gc=sgen), on macOS you can select the runtime architecture to be used (--arch=32 or --arch=64), and more. |
| Use mono runtime | If you are working on Windows, you can check how your application works with the mono runtime. JetBrains Rider will use the mono executable specified on the page of JetBrains Rider settings Ctrl+Alt+S. To debug with mono runtime, you need:
|
| Use external console: | By default, the output of .NET Core and Mono applications is shown in the Run or Debug window. Use this checkbox to show the output in an external window. This checkbox does not affect classic .NET application types (for example, .NET Console Application) — their output in always shown in an external window. |
Common
When you edit a run configuration (but not a run configuration template), you can specify the following options:
Item | Description |
|---|---|
Name | Specify a name for the run/debug configuration to quickly identify it when editing or running the configuration, for example, from the Run popup Alt+Shift+F10. |
Allow parallel run | Select to allow running multiple instances of this run configuration in parallel. By default, it is disabled, and when you start this configuration while another instance is still running, JetBrains Rider suggests to stop the running instance and start another one. This is helpful when a run/debug configuration consumes a lot of resources and there is no good reason to run multiple instances. |
Store as project file | Save the file with the run configuration settings to share it with other team members. The default location is .idea/runConfigurations. However, if you do not want to share the .idea directory, you can save the configuration to any other directory within the project. By default, it is disabled, and JetBrains Rider stores run configuration settings in .idea/workspace.xml. |
Toolbar
The tree view of run/debug configurations has a toolbar that helps you manage configurations available in your solution as well as adjust default configurations templates.
| Item | Shortcut | Description |
|---|---|---|
| Alt+Insert | Create a run/debug configuration. | |
| Alt+Delete | Delete the selected run/debug configuration. Note that you cannot delete default configurations. | |
| Ctrl+D | Create a copy of the selected run/debug configuration. Note that you create copies of default configurations. | |
| The button is displayed only when you select a temporary configuration. Click this button to save a temporary configuration as permanent. | ||
| View and edit the template (that is, the default run/debug configuration settings). The templates are displayed under the Templates node and used for newly created configurations. | ||
| Alt+Up/ Alt+Down | Move the selected run/debug configuration up and down in the list. The order of configurations in the list defines the order, in which the configurations appear when you choose a run/debug configuration. Default templates of run/debug configurations are always sorted alphabetically. | |
Move into new folder / Create new folder. You can group run/debug configurations by placing them into folders. To create a folder, select the configurations within a category, click Then, to move a configuration into a folder, between the folders or out of a folder, use drag or To remove grouping, select a folder and click | ||
| Click this button to sort configurations in the alphabetical order. |
Before Launch
In this area, you can specify tasks to be performed before starting the selected run/debug configuration. The tasks are performed in the order they appear in the list.
| Item | Shortcut | Description |
|---|---|---|
| Alt+Insert | Click this icon to add one of the following available tasks:
| |
| Alt+Delete | Click this icon to remove the selected task from the list. | |
| Enter | Click this icon to edit the selected task. Make the necessary changes in the dialog that opens. | |
| Alt+Up/ Alt+Down | Click these icons to move the selected task one line up or down in the list. The tasks are performed in the order that they appear in the list. | |
| Show this page | Select this checkbox to show the run/debug configuration settings prior to actually starting the run/debug configuration. | |
| Activate tool window | By default this checkbox is selected and the Run or the Debug tool window opens when you start the run/debug configuration. Otherwise, if the checkbox is cleared, the tool window is hidden. However, when the configuration is running, you can open the corresponding tool window for it yourself by pressing Alt+4 or Alt+5. |