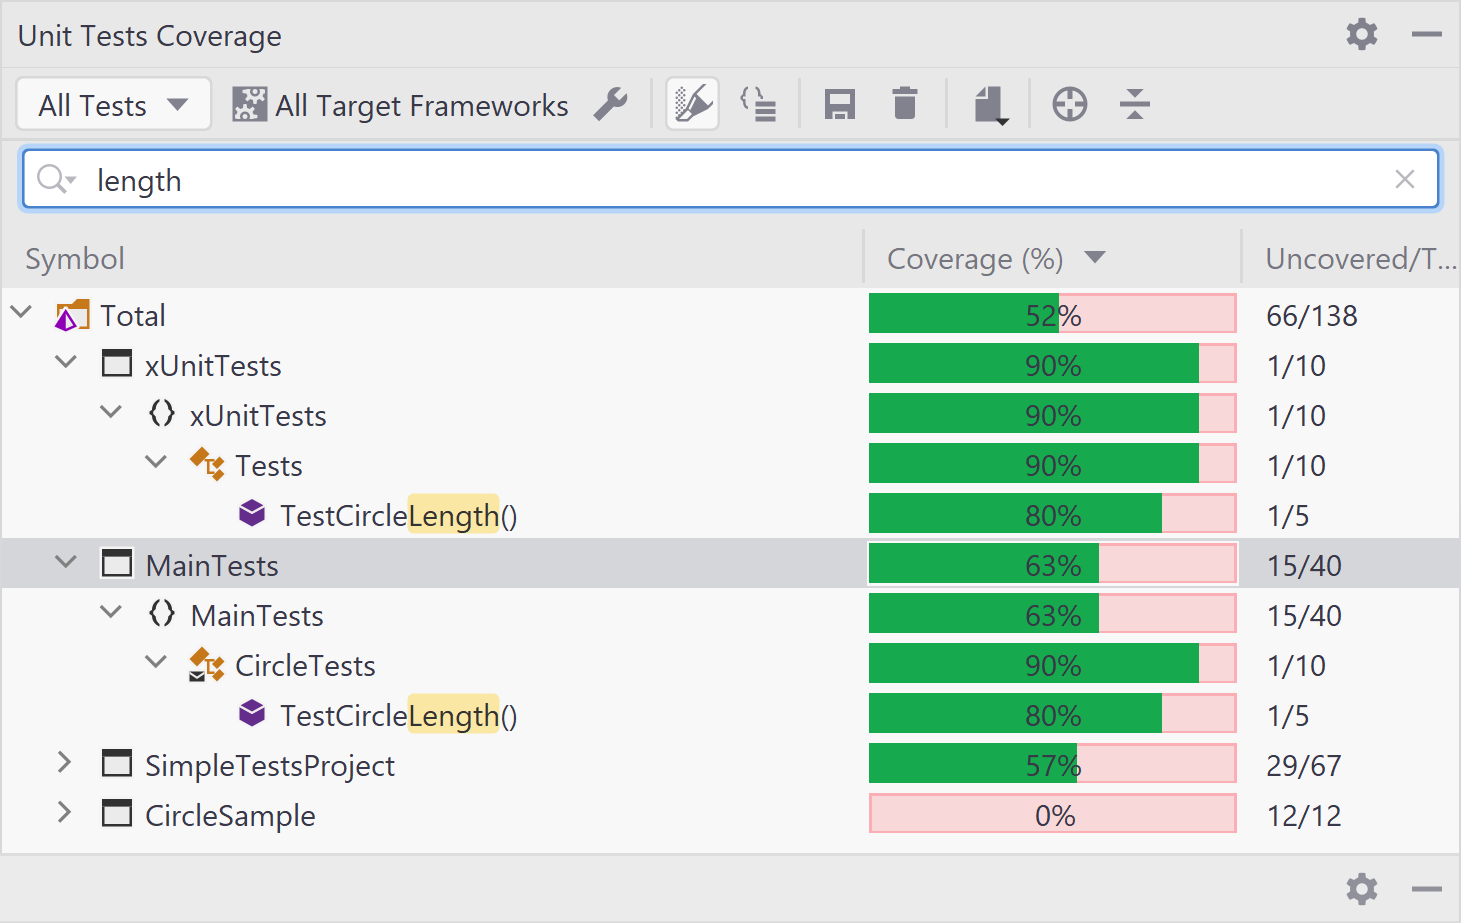
Unit Tests Coverage window
This window allows exploring coverage data obtained during unit tests coverage run. The window shows all code items from a coverage snapshot in a tree structure allowing you to inspect coverage of each item.

In the Coverage column, dotCover uses three colors to display the coverage status:
Green: the percentage of covered statements within the node.
Red: the percentage of uncovered statements within the node.
Grey: the nodes not covered during the test run as they do not have executable code statements.
Toolbar Controls
| Control | Name | Description |
|---|---|---|
| All Tests | If selected, the tree shows aggregated coverage results from all unit test sessions. | |
| All Tests in Active Session | If selected, the tree shows coverage results for all unit tests from the session that is currently selected in the Unit Tests window. | |
| Selected Tests in Active Session | If selected, the tree shows coverage results for the test selected in the current session in the Unit Tests window. | |
| All Target Frameworks | Filters coverage results based on the selected target framework. This list is shown only if your project targets multiple frameworks. | |
| Highlight code | Toggles highlighting of the code in the editor for the current coverage snapshot. For more information, see dotCover documentation. | |
| Flatten Namespaces | Toggles between flat and tree namespace representation. In the flat mode, all namespaces including child namespaces are shown in a flat list (on the same level). | |
| Save coverage snapshot as | Saves the current snapshot to a .dcvr file. For more information, see https://www.jetbrains.com/help/dotcover/Saving_and_Loading_Coverage_Snapshot.html. | |
| Drop coverage results | Removes the existing coverage results. | |
| | Export coverage reports | Allows you to export the test coverage report to one of the selected formats: HTML, JSON, XML, XML for NDepend. |
| Navigate from Editor | Navigates you from a selected symbol in editor to this symbol in the coverage tree. |
