Dynamic Program Analysis (DPA)
Dynamic Program Analysis (or DPA) is a process that runs in the background of JetBrains Rider and checks your application for various memory allocation issues. It currently checks for closures and allocations to large and small object heaps (LOH and SOH). DPA is started automatically each time you run your solution in JetBrains Rider. The allocation data is collected with almost zero overhead: we have tested DPA on a variety of real solutions getting the slowdown from 0 to 2 percent.
To ease the understanding of DPA, you can think of it as of profiling that is always turned on: You do not need to run a profiler, start a profiling session, and get snapshots. Just work as usual, and all data will be collected in the background when you run your solution.

See Getting started with DPA for more details.
Supported OSs and frameworks
OS | Frameworks |
|---|---|
Windows | .NET Framework, .NET Core |
Linux, macOS | .NET Core 3.0 and later |
Prerequisites
DPA is based on Event Tracing for Windows (ETW). To receive ETW events, DPA uses the special 'JetBrains ETW Host Service' that must be installed in your system. Typically, you install this service along with JetBrains Rider installation. If, for some reason, the service is not installed, DPA will be inactive. In this case, follow the instructions below.
Install 'JetBrains ETW Host Service' (only if it was not installed during Rider installation)
Open the Dynamic Program Analysis window by doing one of the following:
Use the menu .
Click the DPA icon
 in the Rider status bar and select View Issues.
Click the Install 'ETW Host Service' link on top of the window.
In the Windows UAC window, allow Rider to make changes on your computer.
Service installation needs to be done only once. If you click the Run 'ETW Host Service' once link, JetBrains Rider will start the service without installation. In this case, the service will be working until the system reboot.
Get started with DPA
Actually, DPA doesn't require any additional steps from your side to start using it. Work as you usually do with some minor addition to your workflow:
Every time you finish running or debugging your project, pay attention to the DPA icon in the status bar. If it's red like this,
 , click it and choose View Issues.
Go through the list of issues. On this step, you can:
Double-click the issue to view its stack trace.
Navigate from an issue to the corresponding code in the editor (with F4).
And navigate back (with Alt+Enter and View memory allocation issues).
If you think that the issue can be fixed, try fixing it using our tips.
After you fix the issue, run the project one more time and make sure it is no longer present in the DPA list.
If you think that the issue cannot be fixed, either suppress or exclude this issue. One more way to make the issue disappear from the list is increasing the memory allocation threshold.
Ideally, you should get the green DPA icon, which looks like this:
 .
.
How DPA works
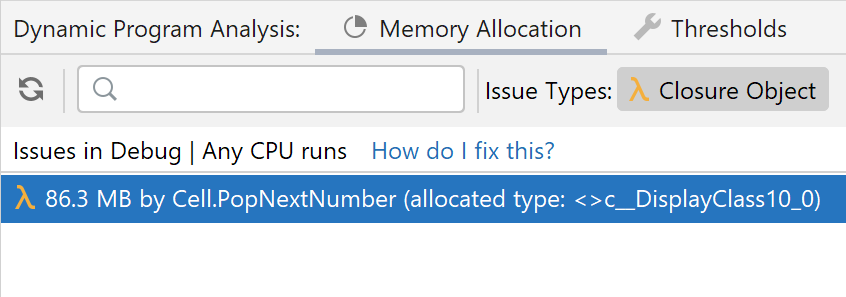
If during program execution the size of allocated memory exceeds the specified threshold, the method in which the allocations take place is considered an issue. DPA adds this method to the list of issues in the Dynamic Program Analysis window.

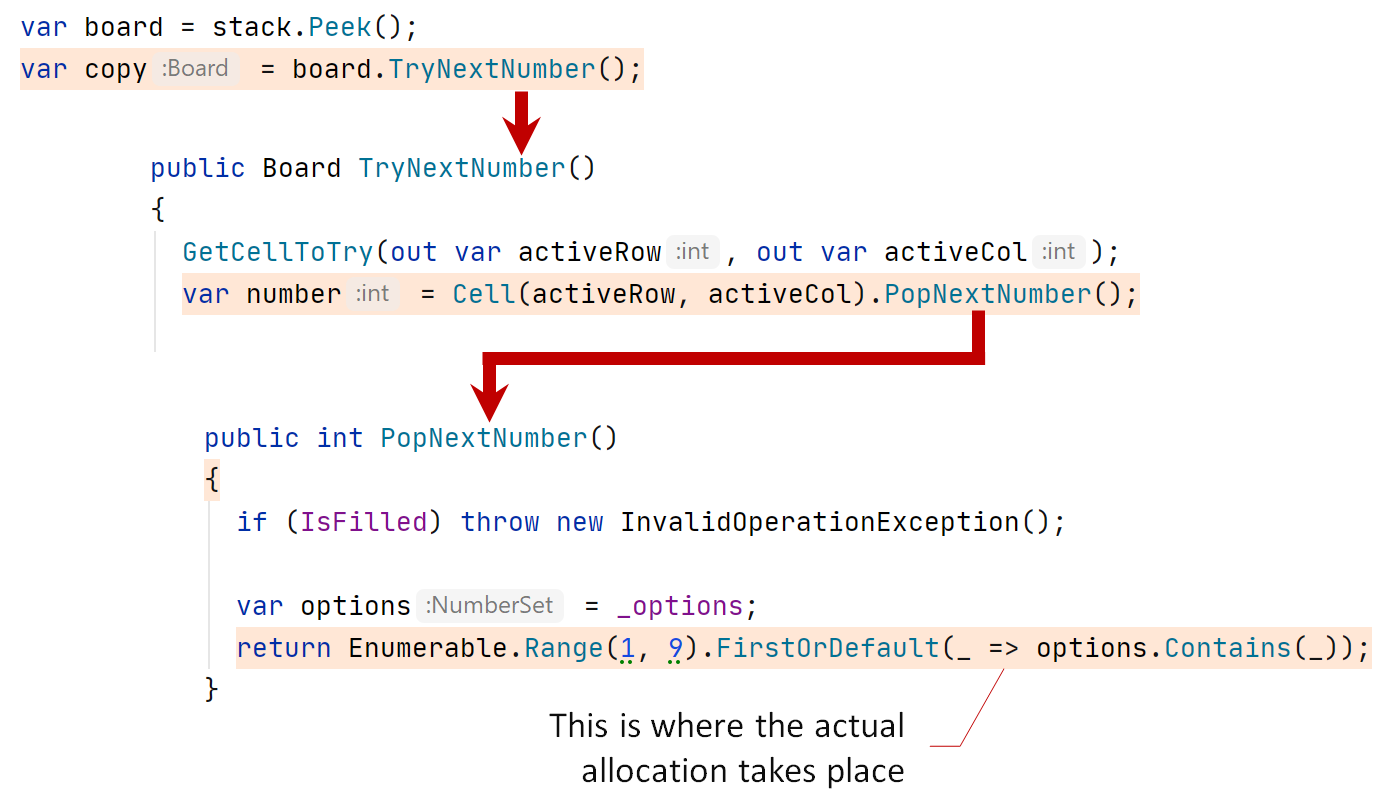
The exact line of code responsible for the allocation is highlighted in the editor.

All methods and lines on the call path are highlighted as well.

If you change the code of the method marked as issue, DPA will consider this as a try for fixing the issue.
If after the fix, memory allocation decreases to a value below the threshold, DPA will consider the issue fixed and will remove it from the list.
If after the fix, the allocation value is still above the threshold, DPA will update the issue in the list with this new value.
If you do not change the code of the method marked as issue, DPA will show you the new issue value and the highest issue value among all runs.

In more detail: For each issue, DPA stores two values - the maximum recorded value and the value from the last run. This prevents false-negatives: An issue could fall below the threshold and disappear from the issue list not because it had been fixed, but because the launch conditions had changed (the program ran for less time, the required functionality was not executed, and so on). The maximum value is shown only in case you haven't changed the code behind the issue between the runs.
DPA does not show muted and suppressed issues in the list and does not highlight the corresponding code in the editor.
Currently, it is not possible to view issue history.
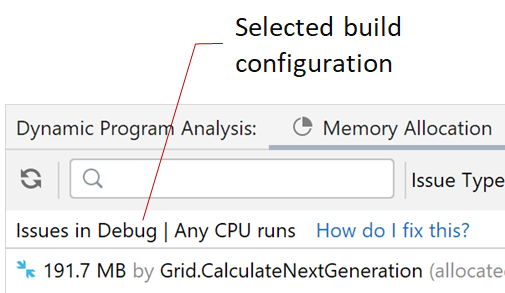
As Debug and Release builds differ from each other, DPA tracks each solution build configuration separately. The Dynamic Program Analysis window shows issues for the currently selected build configuration.

ETW raises the memory allocation event only after the 100 KB allocation threshold is exceeded. Therefore, DPA's level of granularity is 100 KB.
Enable DPA during debugging
During debugging, system assemblies used by your application must provide additional data to the debugger. As a result, these assemblies allocate more memory comparing to regular application run. The problem is that currently, DPA cannot distinguish these additional allocations from "normal" allocations made by your program. This may result in false-positive issues detected by DPA.
Because of all of the above, DPA is disabled when you debug your solution. If you want to enable it in the debugging mode, you should turn on the Enable Dynamic Program Analysis during debugging option in .
Note that this also applies to attaching the debugger to a running application with Attach to Process.
Turn DPA off
If 'JetBrains ETW Host Service' is running in the system, DPA is turned on by default. To disable DPA, click the DPA icon (![]() or
or ![]() ) in the status bar and choose Disable Dynamic Program Analysis.
) in the status bar and choose Disable Dynamic Program Analysis.