Running
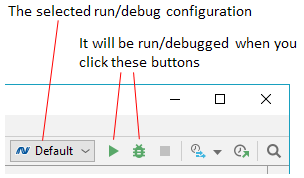
JetBrains Rider lets you run code in any of the supported languages. Each time you execute code in JetBrains Rider, you are using a specific run/debug configuration, which defines what part of your solution is executed and what parameters and environment are used.
Thus, you can execute a single static method, start a multiple-project application, run a unit test, execute your code on a web server, and more — all with different types of JetBrains Rider's run/debug configurations.
You can execute each of the configurations in two ways:
Run (without debugging) — this way is mostly helpful for testing whether your code executes at all and how it behaves.
You can run the currently selected run/debug configuration by pressing Shift+F10, clicking
on the toolbar, or choosing from the menu.
Alternatively, you can press Alt+Shift+F10 or choose from the menu. This will display a popup with all run/debug configurations that you have set up, letting you choose what to run.
Debug — this way you start the code targeted by the selected configuration and automatically attach the debugger to it, meaning that with the debugger features you will be able to see exactly how your code executes and to find problems in your program.
You can start debugging of the currently selected run/debug configuration by pressing Shift+F9, clicking
on the toolbar, or choosing from the menu.
Alternatively, you can press Alt+Shift+F9 or choose from the menu. This will display a popup with all run/debug configurations that you have set up, letting you choose what to debug.

In this section:
- Run/debug configurations
- Run and debug .NET static methods
- Run and debug .NET Core and ASP.NET Core apps with launch profiles
- Run and debug ASP.NET Core apps in IIS Express
- Run anything