Testing Node.js
With JetBrains Rider, you can test Node.js applications using numerous frameworks.
The current page describes testing with Mocha, which is a JavaScript test framework that is especially helpful for executing asynchronous test scenarios. You can run Mocha tests from outside JetBrains Rider, examine test results arranged in a treeview, and easily navigate to the test source from there. Next to the test, in the editor, JetBrains Rider shows the status of the test with an option to quickly run or debug it.
Before you start
Download and install Node.js.
Make sure the Node.js plugin is enabled on the Settings/Preferences | Plugins page, tab Installed. See Managing plugins for details.
Download a testing framework
Although you can use any framework, the recommended one is Mocha.
Install Mocha
In the embedded Terminal (Alt+F12) , type one of the following commands:
npm install mochafor local installation in your project.npm install -g mochafor global installation.npm install --save-dev mochato install Mocha as a development dependency.
Learn more from Getting Started on the Mocha official website.
Install the Chai expectation library as an efficient replacement for Node.js standard assert function.
In the embedded Terminal (Alt+F12) , type:
npm install --save-dev chai
Write tests
Create tests according to the instructions from the Mocha official website.
Run tests
With JetBrains Rider, you can quickly run a single Mocha test right from the editor or create a run/debug configuration to execute some or all of your tests.
Run a single test from the editor
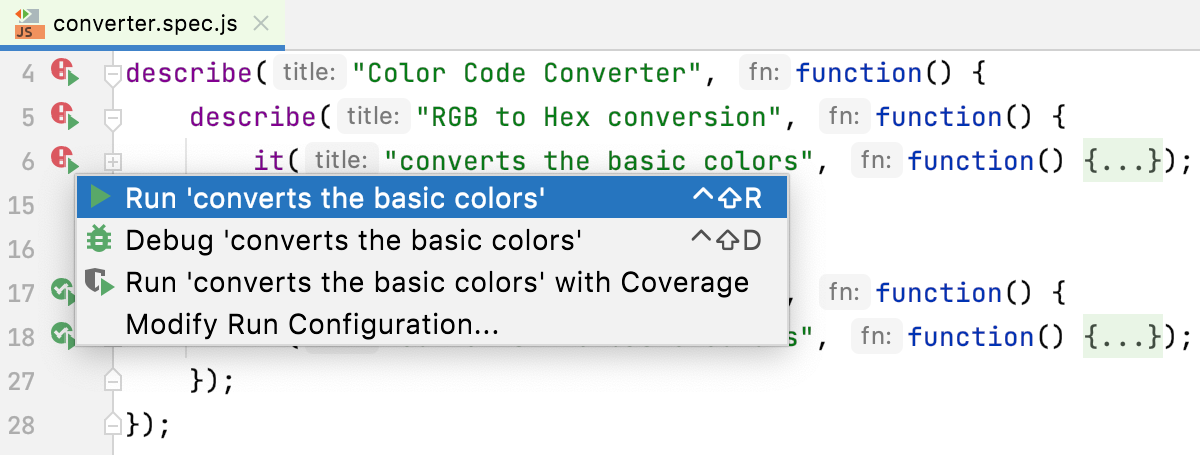
Click
or
in the gutter and select Run <test_name> from the list.
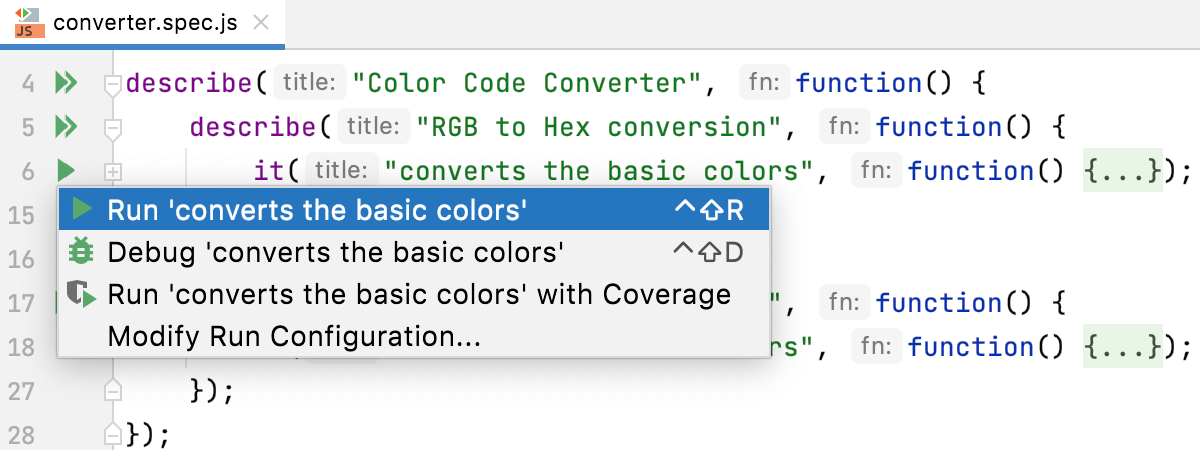
You can also see whether a test has passed or failed right in the editor, thanks to the test status icons
and
in the gutter.

Create a Mocha run configuration
Open the Run/Debug Configuration dialog ( on the main menu), click
in the left-hand pane, and select Mocha from the list. The Run/Debug Configuration: Mocha dialog opens.
Specify the Node interpreter to use and the location of the
mochapackage.Specify the working directory of the application. By default, the Working directory field shows the project root folder. To change this predefined setting, specify the path to the desired folder or choose a previously used folder from the list.
Optionally configure rerunning the tests automatically on changes in the related source files. To do that, add the
--watchflag in the Extra Mocha options field.Specify the tests to run. This can be a specific test or suite, an entire test file, or a folder with test files.
You can also define patterns to run only the tests from matching files, for example,
*.test.js. If the files with tests are stored in a test folder, specify the path to this folder in the pattern relative to the working directory, for example, ./folder1/folder2/test/*.test.js.Choose the interface used in the test to run.
Run tests via a Mocha run configuration
Select the Mocha run/debug configuration from the list on the main toolbar and click
 to the right of the list.
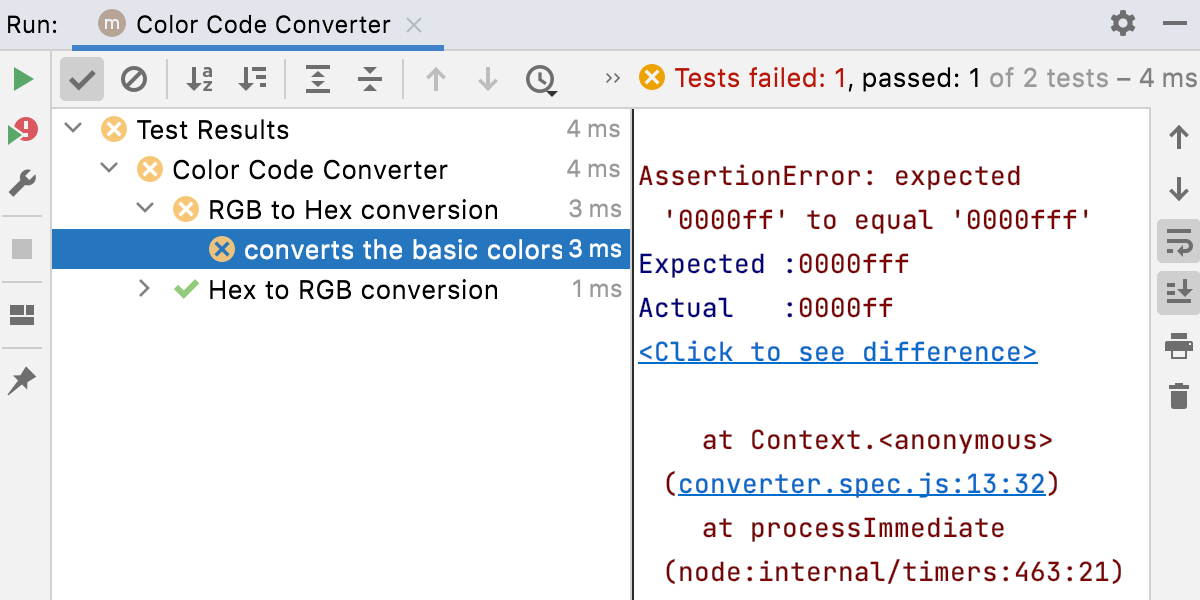
 The test server starts automatically without any steps from your side. View and analyze messages from the test server in the Run tool window. When you select a test in the left-hand pane, the right-hand pane shows the test execution details.
Use the Click to see the difference link to open the Difference viewer and compare the actual result with the expectation.
The name of file with the selected test is show as a link. Click this link to jump to the source code.
Monitor test execution and analyze test results in the Test Runner tab of the Run tool window, see Explore test results for details.

Rerun failed tests
In the Test Runner tab, click
on the toolbar. JetBrains Rider will execute all the tests that failed during the previous session.
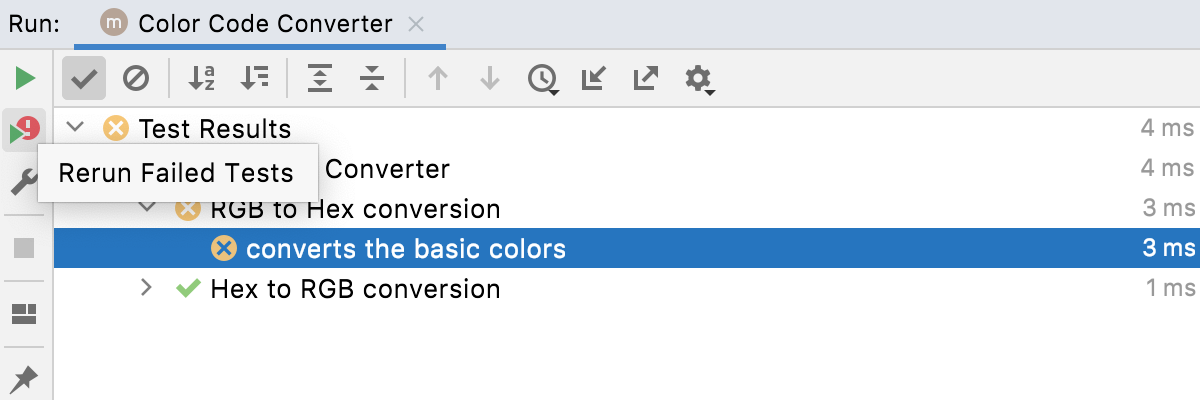
To rerun a specific failed test, select on its context menu.
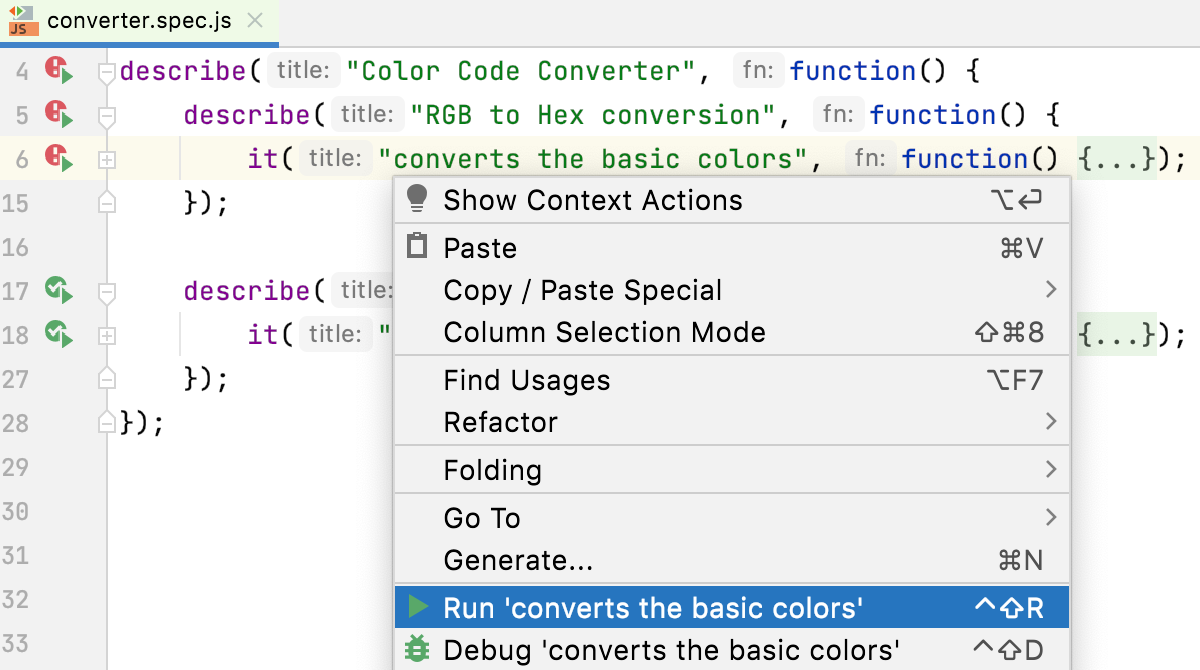
Alternatively, click
in the gutter next to a failed test and select from the list.
See Rerunning tests for details.
Navigation
With JetBrains Rider, you can jump between a file and the related test file or from a test result in the Test Runner Tab to the test.
To jump between a test and its subject or vice versa, open the file in the editor and select or from the context menu, or just press Ctrl+Shift+T.
To jump from a test result to the test definition, click the test name in the Test Runner tab twice, or select from the context menu, or just press F4. The test file opens in the editor with the cursor placed at the test definition.
For failed tests, JetBrains Rider brings you to the failure line in the test from the stack trace. If the exact line is not in the stack trace, you will be taken to the test definition.
Debug tests
If a test fails for unclear reason you can debug the test to find out whether the test is outdated or the changes you made to the source code break the intended behavior of your application.
With JetBrains Rider, you can quickly start debugging a single Mocha test right from the editor or create a run/debug configuration to debug some or all of your tests.
Start debugging a single test from the editor
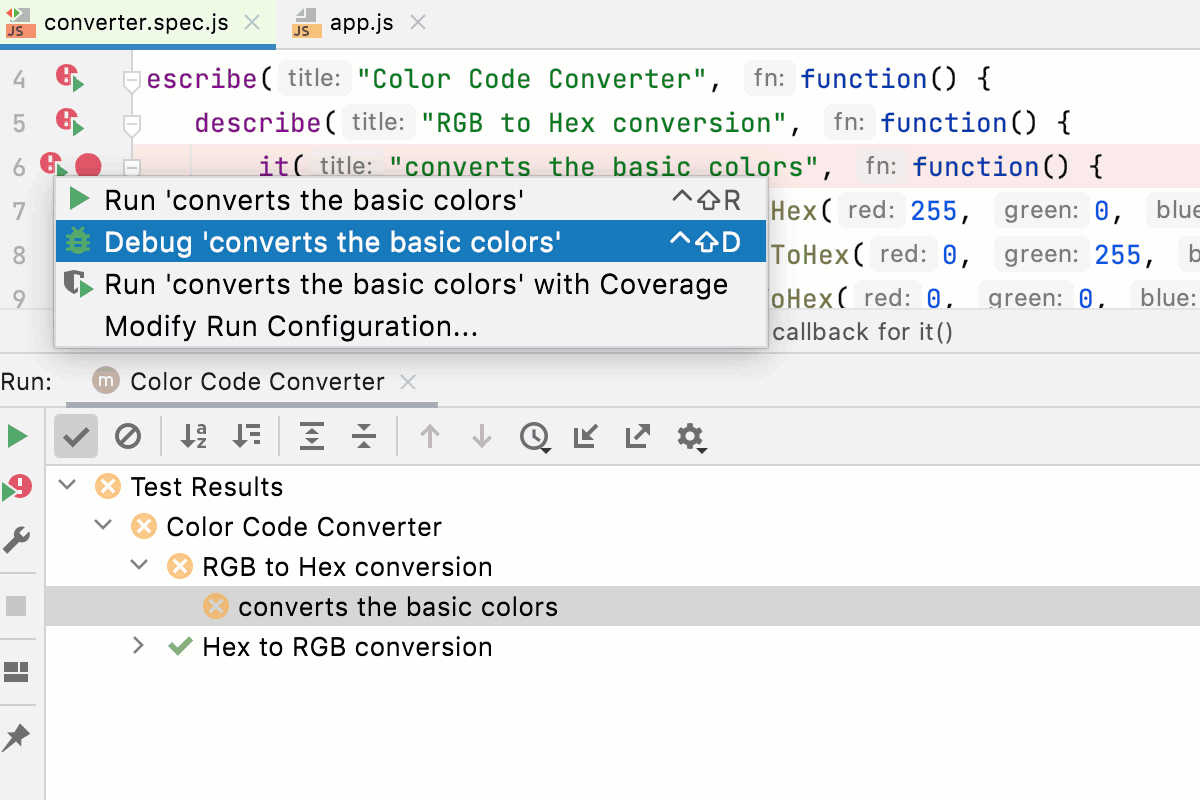
Set a breakpoint in the gutter next to the test you want to debug. You can jump to a failed test by double-clicking it in the Run tool window or by pressing F4.
Click
or
in the gutter and select Debug <test_name> from the list.
In the Debug tool window, proceed as usual: step through the program, stop and resume the program execution, examine it when suspended, view actual HTML DOM, run JavaScript code snippets in the Console, and so on. .
Debug test with a Mocha run/debug configuration
Set the breakpoints next to the tests that you want to debug. You can jump to a failed test by double-clicking it in the Run tool window or by pressing F4.
Create a Mocha run/debug configuration as described above.
Select the Mocha run/debug configuration from the list on the main toolbar and click
 to the right of the list.
 In the Debug window that opens, proceed as usual: step through the tests, stop and resume test execution, examine the test when suspended, run JavaScript code snippets in the Debugger Console, and so on.
Learn more from Debug failed tests.
Monitor code coverage
With JetBrains Rider, you can also monitor how much of your code is covered with Mocha tests. JetBrains Rider displays this statistics in a dedicated Coverage tool window and marks covered and uncovered lines visually in the editor and in the Project tool window. To monitor coverage, you need to install nyc, the command-line interface for Istanbul.
Install nyc
In the embedded Terminal (Alt+F12) , type:
npm install --save-dev nyc
Run tests with coverage
Launch the tests:
Create a Mocha run/debug configuration as described above, select it from the list on the main toolbar, and click
to the right of the list.
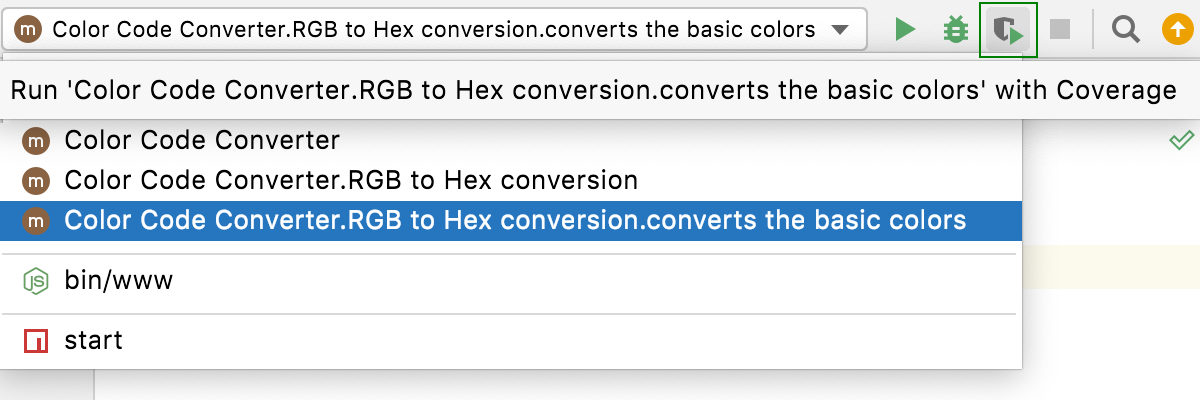
Alternatively, run a specific suite or a test with coverage from the editor: click
or
in the left gutter and select Run <test_name> with Coverage from the list.
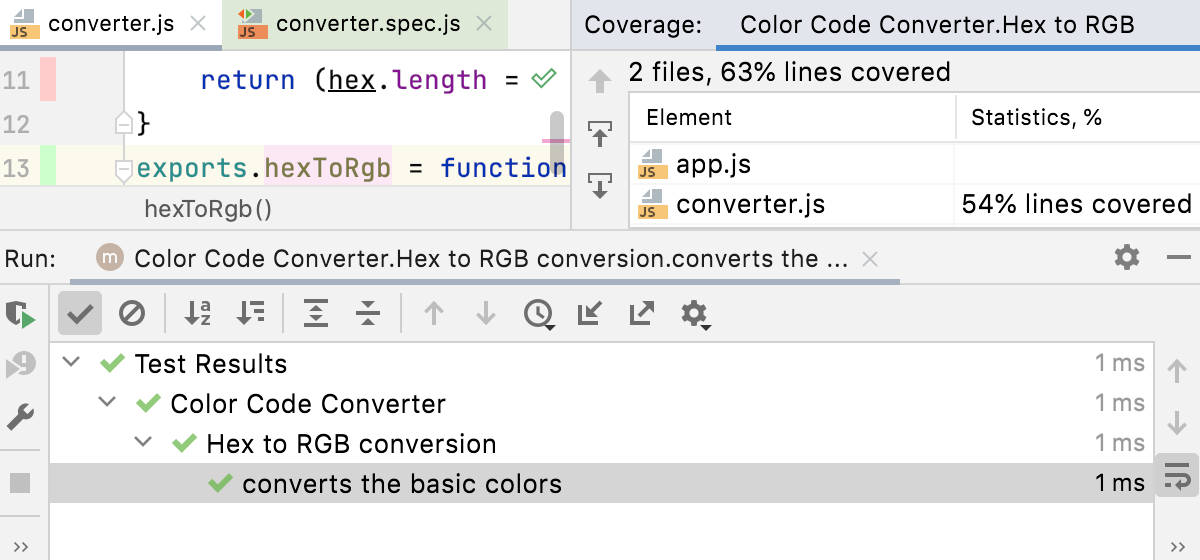
Monitor the code coverage in the Coverage tool window. The report shows how many files were covered with tests and the percentage of covered lines in them. From the report you can jump to the file and see what lines were covered – marked green – and what lines were not covered – marked red:
Run tests with Node.js inside a Docker container
With JetBrains Rider, you can run Mocha tests inside a Docker container just in the same way as you do it locally.
Before you start
Make sure the Node.js, Node.js Remote Interpreter, and Docker required plugins are enabled on the Settings/Preferences | Plugins page, tab Installed, see Managing plugins for details.
Download, install, and configure Docker as described in Docker
Configure a Node.js remote interpreter in Docker and set it is as default in your project. Also make sure the package manager associated with this remote interpreter is set as project default.
Open your package.json and make sure the required test framework is listed in the
devDependenciessection:{ "name": "node-express", "version": "0.0.0", "private": true, "dependencies": { "cookie-parser": "~1.4.4", "debug": "~2.6.9", "express": "~4.16.1", "http-errors": "~1.6.3", "morgan": "~1.9.1", "pug": "^3.0.2" }, "devDependencies": { "chai": "^4.3.4", "concurrently": "^6.3.0", "eslint": "^8.1.0", "http-server": "^14.0.0", "jest": "^27.3.1", "mocha": "^9.1.3", "nyc": "^15.1.0" } }Right-click anywhere in the editor and select Run '<package manager> install' from the context menu.
Run tests
Create tests according to the instructions from the Mocha official website.
Proceed as with local development: run and debug single tests right from the editor or create a run/debug configuration to launch some or all of your tests as described in Run tests and Debug tests above.