Solution-wide analysis
JetBrains Rider's solution-wide analysis enables two related but distinct features:
Solution-wide errors/warnings monitor, which lets you constantly keep track of all errors/warnings in your solution: both compiler errors/warnings and errors/warnings detected by JetBrains Rider’s own inspections. This feature works together with the design-time code inspection and brings two advantages:
You do not have to open every file to make sure that your solution does not contain errors/warnings.
If you delete a public member or change its visibility, the code in the current file can still be correct, but what if this member is used somewhere else in the solution? For example, suppose that you changed the visibility of a member from
publictointernal, assuming that it was only used inside the current project. At this stage, JetBrains Rider finds no errors in the current file. Then, you switch on solution-wide analysis, and actually there are errors. You can jump to the next error in solution and find out that someone uses this member from another project in your solution.
Solution-wide code inspections, which help find issues that can only be detected by analysing the whole solution (unused public types and members, unassigned public fields, suspicious type conversions and so on). When solution-wide analysis is enabled, issues detected by the solution-wide inspections are highlighted in the opened files in the same way as other issues, and they also appear in the Inspection Results window when you run code inspection in specific scope.
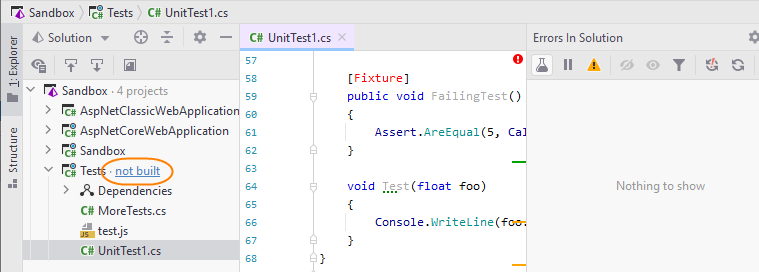
Note that solution-wide analysis doesn't monitor errors in projects that are not built in the current solution configuration.

Enable solution-wide analysis
Solution-wide analysis can take some time for the initial processing of the solution but once it is complete, it works in the background and does not consume much resources. If you have a very large solution and experience performance problems, you may want to disable solution-wide analysis.
On the page of JetBrains Rider settings Ctrl+Alt+S, make sure that the Enable code analysis checkbox is selected, and click Enable solution-wide analysis. Optionally, you can enable or disable warnings in solution-wide analysis.
Optionally, select Enable computationally expensive inspections, which turns on the data-flow analysis and brings additional inspections, for example, to calculate nullability.
Optionally, select Monitor warnings to add warnings to the analysis.
Click Save in the Settings dialog to apply the modifications and let JetBrains Rider choose where to save them, or save the modifications to a specific settings layer using the Save To list. For more information, see layer-based settings.
Alternatively, you can click the circle indicator in the right corner of the status bar and use the context menu to toggle solution-wide analysis.
After you have switched on solution-wide analysis, several changes are made:
The status-bar indicator displays the progress of the analysis. After the analysis completes, the indicator turns green (if no errors/warnings were found), orange (if warnings in solution-wide analysis are enabled and if there are warnings in the solution), or red (if errors were discovered):

A small area to the left of the circle indicator is allocated to show the number of solution files that contain errors/warning, if any. You can click this area to go to next error/warning in the solution.
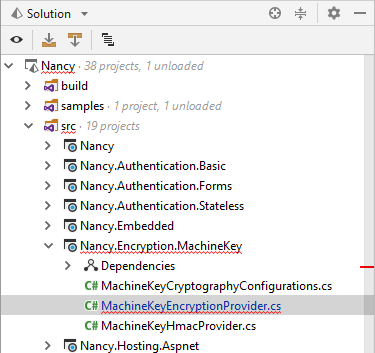
Files where JetBrains Rider has detected errors as well as all their parent items are highlighted with red underlines in the Solution Explorer.

Solution-wide code inspections for non-private members become available both in the design-time code inspection and when you inspect code in a specific scope.
Monitor warnings in solution
If you monitor warnings in the solution, the analysis becomes more resource-intensive and can affect performance on large solutions. Therefore, you can explicitly enable or disable monitoring of warnings.
Include/exclude warnings in solution-wide analysis
When solution-wide analysis is enabled, do one of the following:
On the page of JetBrains Rider settings Ctrl+Alt+S, use the Monitor warnings checkbox under Enable solution-wide analysis.
On the toolbar of the All Solution Files tab of the Problems tool window Alt+6, click
 and then click Warnings.
To stop monitoring warnings, clear the Monitor warnings checkbox on the page of JetBrains Rider settings Ctrl+Alt+S.
When warnings are enabled in solution-wide analysis, it works as follows: as long as there are errors in the solution, only errors will be displayed; unresolved warnings will only appear when the last error is fixed. When warnings are disabled, the status bar indicator will turn green as soon as the last error is fixed.
Study the list of errors/warnings
While solution-wide analysis is enabled, you can use the status bar indicator to monitor errors/warnings in solution, but you can also get a detailed report on all errors/warnings in your solution in the All Solution Files tab of the Problems tool window Alt+6.
View the list of errors/warnings in solution
Do one of the following:
Choose from the main menu or press Alt+6, and then switch to the All Solution Files tab .
Click the circle indicator in the right corner of the status bar and choose Show Errors in Tool Window from the list.
Double-click the circle indicator.
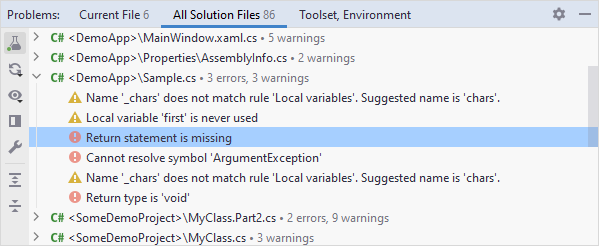
Either way, the All Solution Files tab of the Problems tool window Alt+6 opens where you can view the list of detected errors/warnings and navigate to the related code by double-clicking the entries:

Even without opening this window, you can still easily navigate through errors in your solution with Alt+F2/ Alt+Shift+F2, or just by clicking the number of errors/warnings to the left of the status bar indicator.
Exclude specific frameworks from analysis
If you are only interested in code issues from specific frameworks, you can focus on these issues and ignore issues from other frameworks. This can be helpful in two cases:
When different projects in your solution target different frameworks, and you want to ignore some projects according to their target frameworks.
When a project targets multiple frameworks and only some of those frameworks are relevant.
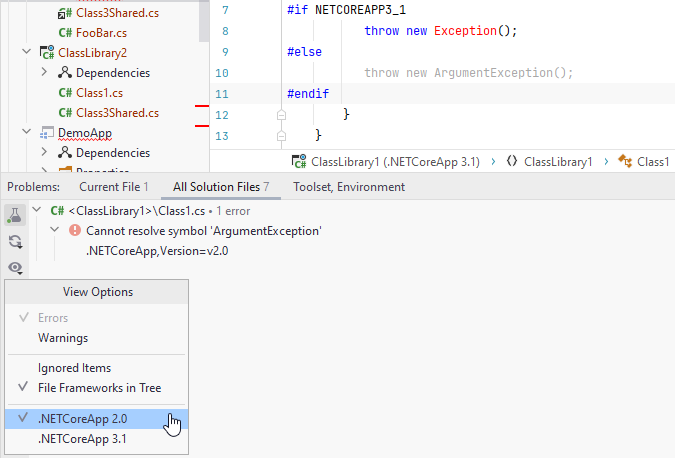
In both cases, click View Options ![]() in the All Solution Files tab of the Problems tool window Alt+6 and select the desired items under Frameworks:
in the All Solution Files tab of the Problems tool window Alt+6 and select the desired items under Frameworks:

Note that in the example above, errors from solution-wide analysis only include unresolved ArgumentException, while the editor highlights unresolved Exception. This happens because the target framework for design-time inspection in the current project is configured independently of the target frameworks for solution-wide analysis.
Performance of solution-wide analysis
The main calculations of solution-wide analysis are performed when you first enable it. Depending on the size of your solution, these calculations may take from several seconds up to dozens of minutes. You will still be able to keep working, but some performance degradation is possible.
Once these global time-consuming calculations are finished, only necessary incremental analysis will be performed according to modifications.
When enabled, solution-wide analysis might also extensively use memory. If you notice that your system resources suffer too much, you can do one of the following:
Ignore errors/warnings in solution
At some stage of your solution development, you may have too many errors/warnings known to you. JetBrains Rider allows you to flexibly ignore some errors or error-containing files and not include them into solution-wide analysis results.
Such items will be hidden from the error list in the All Solution Files tab of the Problems tool window Alt+6 and they will not affect the state of the status bar indicator. When necessary, you can stop ignoring these items to display them.
Allow solution-wide analysis to ignore specific errors/warnings
In the All Solution Files tab of the Problems tool window Alt+6 select a discovered problem or, if you want to ignore all issues in a specific file, select this file.
Right-click the selected item and choose Ignore Error(s)
.png) .
.To view the ignored errors/warnings, click
 on the toolbar and then click Ignored Items — you will see all errors/warnings in the solution, the ignored items are shown as crossed out. Even if you choose to display ignored items in the list, they will not affect the status bar indicator.
To stop ignoring an item, right-click it and choose Stop Ignoring Error(s)
.png) .
.