Fix issues found by DPA
If memory allocation is essential for any program, why does DPA use it as an issue metric? The problem is not in memory allocation, which is very cheap in terms of performance, but in the garbage collection (GC) which may require a lot of system resources. The more memory you allocate, the more you have to collect in the future. For a quick reminder on how .NET manages memory, refer to the JetBrains dotMemory documentation.
But is there anything you can do? From our experience, yes, there are a lot of cases where excessive memory allocation is a result of bad code design. In this chapter, you will find examples of such code design and tips on how you can fix it.
Also, we want to strongly recommend that you use the Heap Allocations Viewer plugin in conjunction with DPA. The plugin highlights all the places in your code where memory is allocated. It's a perfect match for DPA - together they make a perfect couple. While the plugin shows allocations and describes why they happen, DPA shows whether a certain allocation is really an issue.

Closure
- What is it?
Closure occurs when you pass some context to a lambda expression or a LINQ query. To process a closure, compiler creates a special class and a delegate method:
<>c__DisplayClass...andFunc<...>. Note that a LINQ also generates an enumerator each time you call it.- How to find it?
DPA marks the allocations of the
<>c__DisplayClass...as a Closure issue, whileFunc<...>allocations are marked as a Small Object Heap issue. Learn more- How to fix it?
Typically, you can rewrite your code so that the context is not passed to a lambda. In case of LINQs, the only solution is not to use them.
Closures in lambda expressions
Lambda expressions are a very powerful .NET feature that can significantly simplify your code in certain situations. Unfortunately, if used wrongly, lambdas can significantly impact app performance.
Consider the example. Here, we have some StringUtils class that has a Filter method used to apply filters on a list of strings:
We want to use this method to filter out strings that are longer than some specified length. We will pass this filter to the condition argument using a lambda. Note that the resulting code (after compilation) will depend on whether the lambda contains a closure. Closure is a context that is passed to a lambda, for example, a local variable declared in a method that calls the lambda. In our case, the context is the desired string length.
The most obvious way to use the filter is to pass string length as an argument: length.
If you decompile the code above with, say, JetBrains dotPeek, you will see that:
The compiler creates the
<>c__DisplayClass0_0class, that stores the lambda in theb__0method.When you run the method containing a lambda, first, a new instance of the
<>c__DisplayClass0_0class is created.Then, the lambda is called by creating a
Func<>delegate:new Func<string, bool>((object) cDisplayClass00, __methodptr(b__0))).Count)
Each time you call the lambda, new class instance and a new delegate instance are allocated. The resulting allocations caused by the lambda is the sum of points 2 and 3. If the lambda stays on a hot path (is called frequently), a large amount of memory will be allocated.
How DPA shows this
Let's call the method containing the lambda 10000 times. DPA detects the creation of the <>c__DisplayClass0_0 class (point 1 in the list above) and marks these allocations as a Closure issue. Note that in case of closure, DPA highlights the first opening brace of the method as an issue.

The issue looks as follows (the allocations of the <>c__DisplayClass0_0 type):

Currently, the allocations of the lambda delegate (point 2 in the list above) are not marked as a Closure but as a Small Object Heap issue:

The issue looks as follows (the allocations of the Func<...> type):

How to fix
The main strategy when using lambdas is avoiding closures. In such a case, an instance of the special <>c__DisplayClass0_0 class will be cached and the created delegate will be made static. As a result, there will be no additional memory allocations. Thus, for our example, one solution is passing the parameter length not to the lambda but to the Filter method. The fix would look as follows:
If we now run the project and check DPA results we will see that no closure is detected: neither <>c__DisplayClass0_0 nor Func<> instances are created.


Method group instead of lambda
Back in 2006, C# 2.0 introduced the 'method group conversion' feature, which simplifies the syntax used to assign a method to a delegate. In our case, this means that we can replace the lambda with a method and then pass this method as an argument.
There is no closure here, so, will this approach generate additional memory allocations? Unfortunately, yes. If we look at the DPA analysis results, we will see that the method creates a new instance of Func<string, bool> each time FilterLongString() is called. Called 10,000 times, it will spawn 10,000 instances.


So, when using method groups, exercise the same caution as when you use lambdas with closures. They may generate significant memory traffic if staying on a hot path.
Closures in LINQ queries
The concepts of LINQ queries and lambda expressions are closely connected and have very similar implementation "under the hood". This means that all concerns we've discussed for lambdas are also valid for LINQs. If your LINQ query contains a closure, the compiler won't cache the corresponding delegate. For example:
How DPA shows this
As the threshold parameter is captured by the query, its delegate (Func<String, Boolean>), as well as the corresponding <>c__DisplayClass0_0 instance will be created each time the method is called. If we call GetLongNames() 10000 times, DPA will detect corresponding issues:

Enumerator allocation in LINQ queries
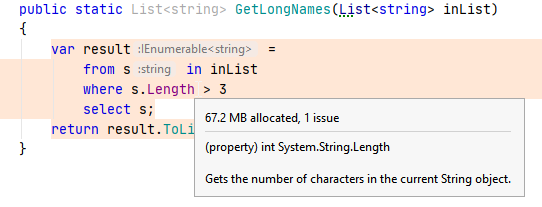
Unfortunately, there's one more pitfall to avoid when using LINQs. Any LINQ query (as any other query) assumes iteration over some data collection, which, in turn, assumes creating an iterator. The subsequent chain of reasoning should already be familiar: if this LINQ query stays on a hot path, then constant allocation of iterators will generate significant memory traffic. Let's change the previous example so that it doesn't contain a closure:
If we call GetLongNames 10000 times, there will still be memory allocations:

The Dynamic Program Analysis window will show the following issue of the Small Object Heap type:

It is quite easy to recognize this type of issue: there's always a class that has Iterator in its name.
How to fix
Unfortunately, the only answer here is to not use LINQ queries on hot paths. In most cases, a LINQ query can be replaced with a foreach. In our example, a universal fix that generates neither closure nor enumerator allocations could look like this:
Small Object Heap
The alternative name for this issue type is "Uncategorized". Strictly speaking, it includes all memory allocations made by an application that exceed the Small Object Heap threshold. In the future releases, we will introduce more memory allocation inspections. This means that many issues from Small Object Heap will get their specific issue type. As for now, the only recommendation is to manually check issues of the Small Object Heap type on whether they have patterns described on this page.
Boxing
Boxing is converting a value type to a reference type. For example:
The problem is that value types are stored on the stack, while reference types are stored in the managed heap. This affects performance twice:
To assign an integer value to a string, CLR has to take the value from the stack and copy it to the heap.
Objects (strings in our case) stored in the managed heap are garbage-collected.
How DPA shows this
Detecting boxing is an easy task with DPA. In the issue list, check the allocated type. If it's a value type, then it's definitely the result of boxing. For example, let's call the code above 10000 times. The issue shows that the allocated type is int32:

In the editor, the Heap Allocations Viewer also warns about boxing allocations:

How to fix
Typically, it is possible to rewrite your code so that it doesn't require boxing. In our example, the easy fix is to call the ToString() method:
Class instead of struct
Another example of boxing is related to the struct type. If a type represents a single value, it can be defined as a struct. Defining it as a class (and this is a common mistake) makes it a reference type. So, its instances are placed to the managed heap instead of the stack, and as a result, the instances that are no longer needed must be garbage-collected.
For example, we have some Account type that consists of some enum field and an int property. Though we can define the type as struct, we mistakenly use class instead:
How DPA shows this
Unfortunately, there is no hint on this issue. All you see in DPA is that the code allocates instances of some reference type. So, it could be just a "normal" allocation that goes to the Small or Large Object Heap. Say, we create 10000 accounts:

In the editor, this looks as follows:

How to fix
The fix is obvious: define the type as struct instead of class. In our example, it would be:
Resizing collections
Dynamically-sized collections such as Dictionary, List, HashSet, and StringBuilder have the following specifics: When the collection size exceeds the current bounds, CLR resizes the collection and redefines the entire collection in memory. Obviously, if this happens frequently, your application's performance will suffer.
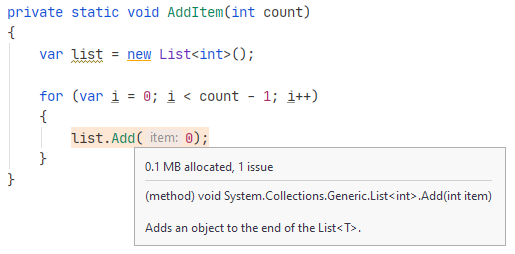
For example, we have some code that adds an element to a list:
How DPA shows this
The insides of dynamic collections can be seen in the managed heap as arrays of a value type (for example, Int32[] in case of Dictionary) or of the String[] type (in case of List). Thus, finding such allocations in the issue list is the main hint.

In the editor, the main hint is that this array is allocated indirectly: not by the new keyword but by some other method:

Note that the line var list = new List<int>(); makes no allocations as it defines an empty list with no elements inside.
How to fix
If the traffic caused by the 'resize' methods is significant, the only solution is reducing the number of cases when the resize is needed. Try to predict the required size and initialize a collection with this size or larger. Another strategy is allocating the guaranteed-sufficient amount of memory with further truncating using Truncate().
In our example, the fix could look as follows:
Enumerating collections
When working with dynamic collections, pay attention to the way you enumerate them. The typical major headache here is enumerating a collection using foreach only knowing that it implements the IEnumerable interface. Consider the following example:
The list in the EnumerateCollection() method is cast to the IEnumerable interface, which implies further boxing of the enumerator.
How DPA shows this
You should check issues for allocations of the Enumerator<> type.

In the editor, you can see these allocations in the places of code where you enumerate a collection:

Note that this applies to arrays as well. The only difference is that you should check issues for allocations of the System.SZGenericArrayEnumerator<> type:

How to fix
Avoid casting a collection to an interface. In our example above, the best solution would be to create a EnumerateCollection() method overload that accepts the List<string> collection.
Changing string contents
String is an immutable type, meaning that the contents of a string object cannot be changed. When you modify string contents, a new string object is created. This fact is the main source of performance issues caused by strings. The more you change string contents, the more memory is allocated. This, in turn, triggers garbage collections that impact app performance. The straightforward remedy is to optimize your code to minimize the creation of new string objects.
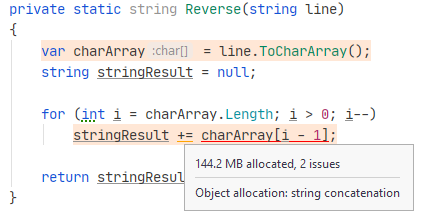
Consider an example of the function that reverses strings:
How DPA shows this
There are no additional hints from DPA for this issue: all you will see is allocations to small or large object heap.

How to fix
In most cases, the fix is to use the StringBuilder class or handle a string as an array of chars using specific array methods. In our example, the code could be as follows:
Large Object Heap
One of the performance tricks applied in .NET comes from the fact that garbage collector should not only remove unused objects but also compact the managed heap. The compaction is done via simple copying, which imposes additional performance penalties. Research has shown that these penalties outweigh heap compaction benefits if the copied objects are larger than 85 KB. For this reason, all such objects are placed in a separate segment of the managed heap called Large Object Heap (LOH). Surviving objects in LOH are not compacted (though you can force garbage collector to compact LOH during full garbage collection). This has two drawbacks:
Your application consumes more and more memory over time: LOH becomes fragmented.
Performance penalties: Interaction with LOH is more complicated than with Small Object Heap.
How DPA shows this
DPA simply tracks all allocations made to LOH: it doesn't distinguish the cause of such allocations. As well as with allocations to Small Object Heap, the fact of allocations to LOH itself means nothing: The allocations may be required by the current use-case.
Allocations to LOH are marked as Large Object Heap issues:

How to fix
Make sure allocations to LOH are inevitable or really required. In some cases allocating objects in LOH makes sense, for example, in the case of large collections that must endure the entire lifetime of an application (e.g. cache).