Attach to and profile .NET processes
dotMemory lets you profile any .NET | .NET Core process that is already running in the system. The profiling workflow looks like follows:
Decide which profiling configuration you will use.
Run a profiling session
Open the dotMemory Profiler tool window, e.g. using the menu .
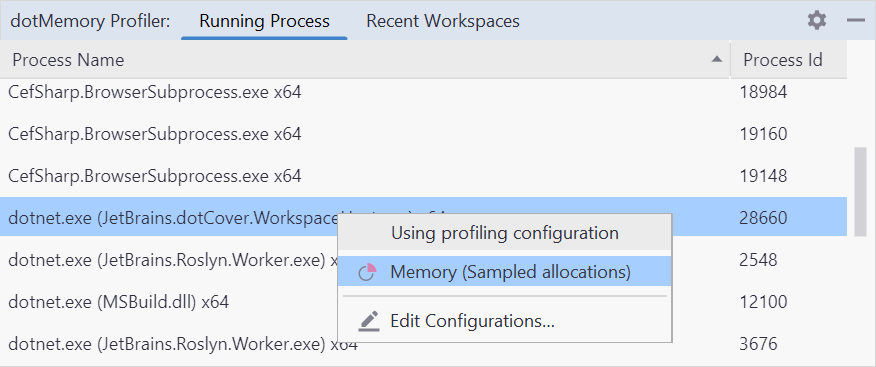
In the dotMemory Profiler tool window, open the Running Process tab.
Select a process you want to profile (note that this must be a managed .NET process), and in the context menu, choose a suitable profiling configuration. Note that it's not possible to collect full allocation data when attaching to a process.

Once the profiling is started, you will see the dotMemory Profiler tool window opened on the Profiling tab with the profiling controller inside.
Basically, now all you need is reproduce the issue you are looking for or, if you just want to evaluate the memory usage, go through the desired usage scenarios in your application. Note that currently, it's not possible to get memory snapshots. You can analyze only memory allocation.
After you collect the data, you can finish the profiling session. Normally, you do it either by closing the profiled application or by detaching the profiler via the
 Detach button (
 Kill forcibly terminates the profiled app and the session, so, use it only in emergency cases).
Analyzing collected data
dotMemory saves the data collected during a profiling session to a workspace. Currently, dotMemory in Rider doesn't support getting memory snapshots. This means that workspaces collected in Rider contain only memory allocation data of your application. To analyze one of the recently collected workspaces, use the Recent Workspaces tab of the dotMemory Profiler tool window.
For more details on how to analyze allocation data, refer to Analyze memory allocation.
About profiling configurations
Before starting a profiling session, you must decide which profiling configuration you will use. Typically, you decide between
the predefined Memory (Sampled allocations) configuration,
or your own custom configuration.
The profiling configuration specifies profiling session settings like which allocation data must be collected, whether child processes must be profiled, and so on.
The profiling target is a running .NET process you're going to attach to.
Create a custom profiling configuration
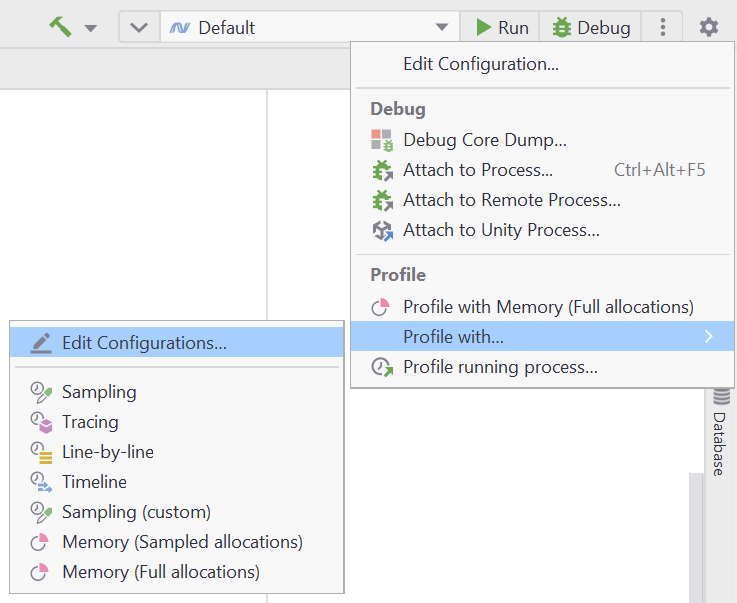
Open the toolbar menu, then choose Profile with.
In the list of profiling configurations, select Edit Configurations...

In the opened Profiling Configurations window, click
to add a new profiling configuration.
In the list, select a data collection mode (always Memory (Sampled allocations) if you're going to profile an attached process).
Specify configuration Name and other profiling options:
- Control profiling manually
Enables you to control profiling manually via the profiler controls.
- Control profiling via API
Enables you to control profiling directly from the code of the profiled application. Learn more about using the API in the dotMemory documentation.
- Profile child processes
If selected, dotMemory will profile not only the main app process but the processes it runs as well.