Inspect variable values and objects
When the program is suspended, you can inspect variables and arguments in the context of the currently selected frame: view their values and edit them on the fly. To change the context, select another frame on the Frames pane.
View variables values
There are several ways of viewing variables values.
Variables pane
The default way to examine variable values is use the Variables pane of the Debug window. Note that if a variable is of a complex type, you can expand the corresponding node in the pane to see values that the variable contains.
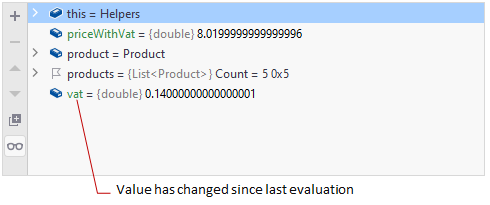
Sometimes, you may notice that some variables change their color. This happens when the variable value has changed since the last evaluation.

You can quickly navigate from a variable on the Variables pane to its declaration in the source code by pressing F4 or choosing Jump to Source from the context menu.
Inline with code
Another way to see variable values is to look at the code in the editor. By default, JetBrains Rider shows the values of variables at the end of the lines where these variables are declared.

Modified objects are displayed with a different color.
You can also click value hints to open the corresponding object in a popup, where you can examine object properties and edit the values F2 or use the variable that contains the value to form an expression for an inline watch.

If you want to disable showing values inline with code, clear the Show Values Inline checkbox on the page of JetBrains Rider settings Ctrl+Alt+S.
Code tooltips
When Show value tooltip is enabled on the Build, Execution, Deployment | Debugger | Data Views page of the IDE settings Ctrl+Alt+S, you can hover the mouse over variables to see their values. If the value of a variable or an expression contains child elements, clicking expands the node and displays all children.

Function return values
The Variables pane will display the return value of any method that is called in the current context. This is useful when the result of a method call is not stored in a local variable, for example, when using method chaining.
Note that function return values are not available for Unity and other Mono-based projects.
Search through values of complex objects
While values of strings or integers are immediately visible in all debugger views, complex objects often contain hundreds of different values hidden in a hierarchical structure.
To find a specific value in a complex object that is currently in scope, focus the variables view in the Debug window and start typing. If the desired value is not found, click Search inside collapsed nodes and start typing again.

Customize debugger presentation of complex objects (Pin to top)
If a type neither has a meaningful ToString() override nor is it annotated with the [DebuggerDisplay] attribute, then the presentation of objects of this type in debugger views could be quite uninformative. In Rider, you can customize presentation of such objects by pinning selected members.
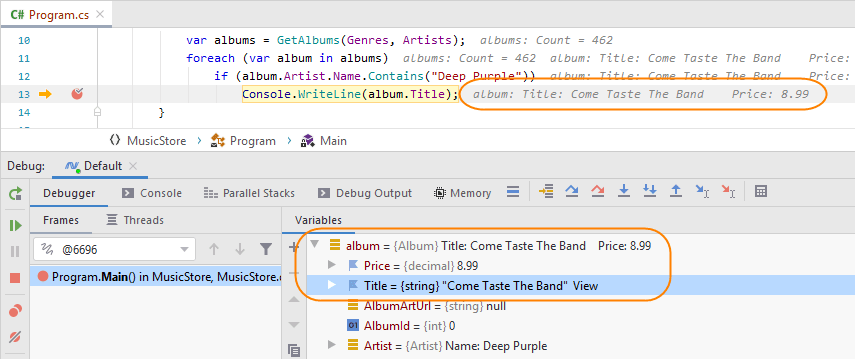
In the example below, an object of Album class is presented with its Title and Price fields:

In the Variables pane of the Debug window, select the desired variable.
Expand the variable, find members that you want to use in the object presentation and click their icons or right-click and choose Pin to top.
The pinned members will move up in the list and their icons will be replaced with the flag icon
 . Values of the pinned members will be used to form the string presentation of the object in debugger views. So make sure that you choose members that have string-compatible values.
All pinned items in the solution are saved and will be also available after restart. You can see all of them in the Bookmarks window under the corresponding node.
To stop using a member in the object presentation, click its flag icon
 in the variables view or right-click it and choose Unpin, or alternatively, locate the pinned item in the Bookmarks window and press Delete.
Pinned items will override object presentation even if it has ToString() or is annotated with the [DebuggerDisplay] attribute.
Modify variables and objects
You can edit variables and objects available in the context of the suspended program. This may be convenient, for example, when you want to reproduce a particular context for the debugged function.
Select a variable or a property of a complex object in the Debug window, press F2 or right-click and choose Set Value... from the context menu, and then specify a new value and press Enter.
If the inline presentation of values is enabled, you can click the inline hint and edit the variable in the popup — for simple values, you can press F2 or click Set Value; for complex objects, you can edit values of selected properties the same way as in the Debug window:

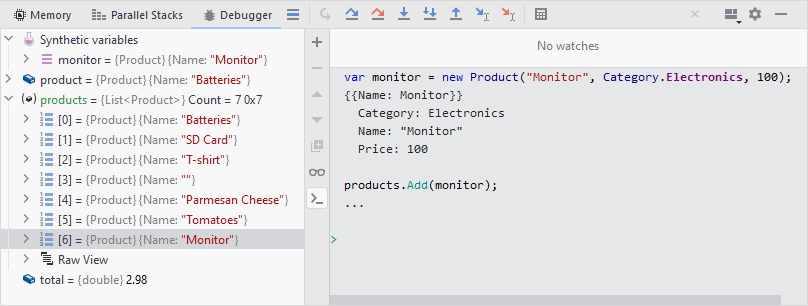
In the Immediate window, type statements that set the desired values to available variables and objects:

For literal values, you can make necessary changes right in the source code and apply them with Hot Reload.
Compare variable values with the clipboard
During debugging, you can compare variable values with the value in the clipboard. This may be especially helpful when debugging strings.
In the Variables pane of the Debug window, select the desired variable.
Right-click the variable and choose Compare Value with Clipboard from the context menu.
The comparison result will be displayed in the Differences viewer.