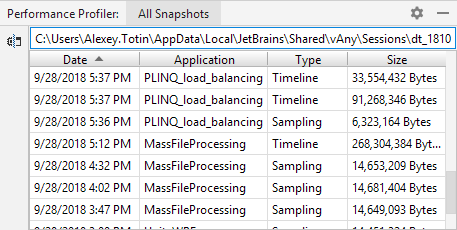
dotTrace Profiler window
This window allows you to profile and analyze performance bottlenecks in .NET applications.
The dotTrace Profiler is a multi-tab window consisting of:
The All Snapshots tab used to open collected snapshots
The Profiling tab used to control a profiling session.
Analysis tabs used to analyze collected performance snapshots.
All Snapshots tab

The All Snapshots tab is used to open previously collected snapshots. The tab contains a table with four columns each showing the corresponding snapshot parameter: Date, Snapshot, Profiling Type, and Size. The field on the top shows an absolute path to the snapshot file.
To open a snapshot, double-click it.
Profiling tab

After you start a profiling session, the dotTrace Profiler window will be opened on the Profiling tab. The tab allows you to manually control the session using the buttons on the toolbar:
Toolbar Controls
Control | Name | Description |
|---|---|---|
| Start Recording | Start collecting performance data. If you see this button right from the session start, then you have not selected the Collect profiling data from start checkbox in the profiling options. |
| Get Snapshot | Generate a snapshot and stop collecting performance data. |
Restart | Discard the collected performance data and restart collecting. | |
Detach | Detach All | Detach dotTrace from the profiled process | processes, but keep the process(es) running. Not available when using the Tracing or Line-by-line profiling types. The snapshot is not taken. | |
Kill | Kill All | Kill the profiled process | processes. The snapshot is not taken. |
Important: the profiler will automatically get a snapshot if you close the profiled application or the application successfully finishes working.
The Profiling tab contains two lists:
The list of profiled processes on the left.
The list of collected snapshots on the right. The row marked with the
 icon indicates the currently collected data.
Snapshot analysis tabs
After you double-click a snapshot on the All Snapshots tab, the snapshot will be opened in a separate tab of the dotTrace Profiler window. The tab will be named after the name of the profiled process.
Use the analysis tab to analyze the snapshot: find the slowest methods, navigate through the call tree, and so on.
The tab consists of two views:
Call Tree: a call tree that shows all method calls in all threads. For more information on Call Tree, refer to the dotTrace documentation.
Top Methods: a plain list of methods with the highest own time. For more information on Top Methods, refer to the dotTrace documentation.


