Interactive debugger console
Required plugins:
Javascript and TypeScript, JavaScript Debugger - The plugins are bundled with JetBrains Rider and enabled by default.
note
The interactive Console pane is shown only during a debugging session. It is not available when you are running an application or previewing web pages.
Debugging of JavaScript code is only supported in Google Chrome and in other Chromium-based browsers.
Navigate to source code
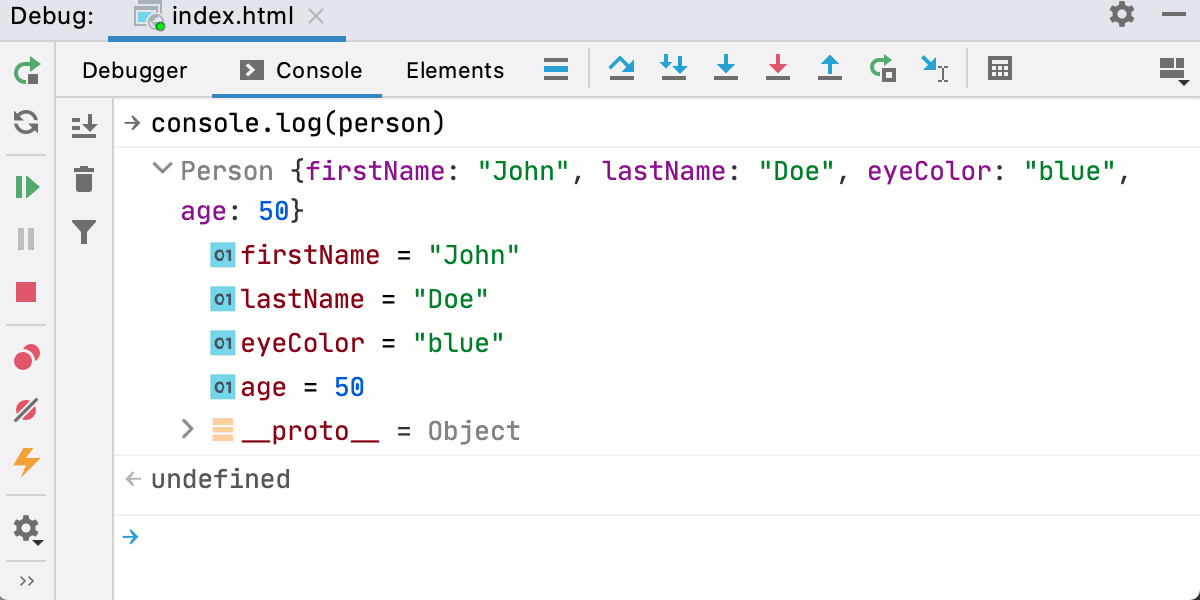
At each line with output of
console.*, JetBrains Rider shows the name of the file and the line where it was called. Click this link to jump to the call in the source code.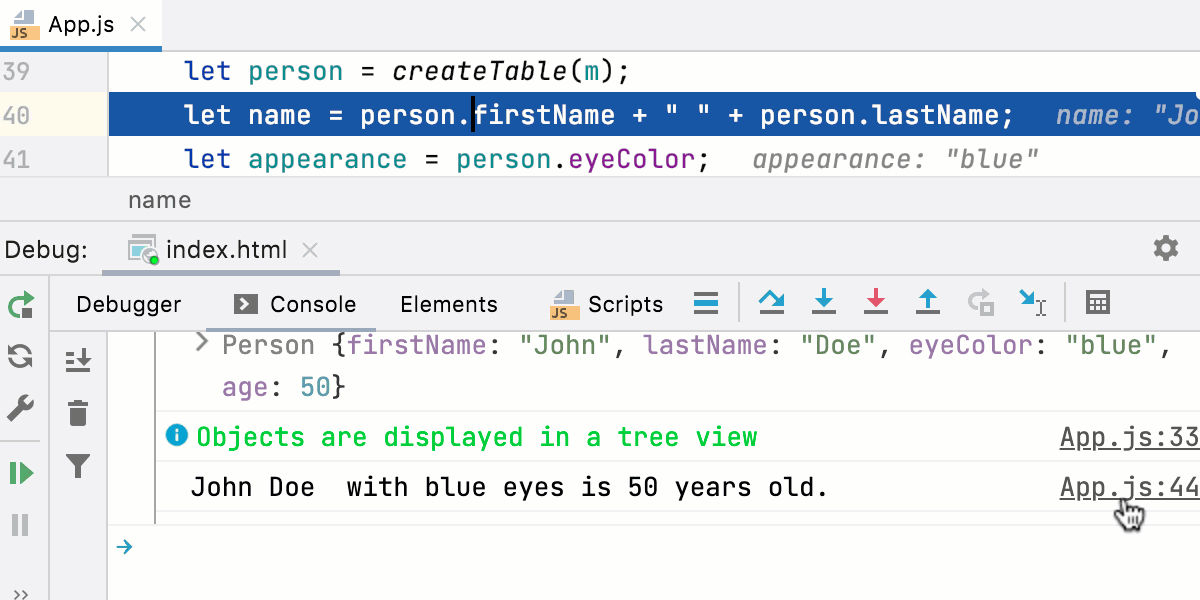 Gif
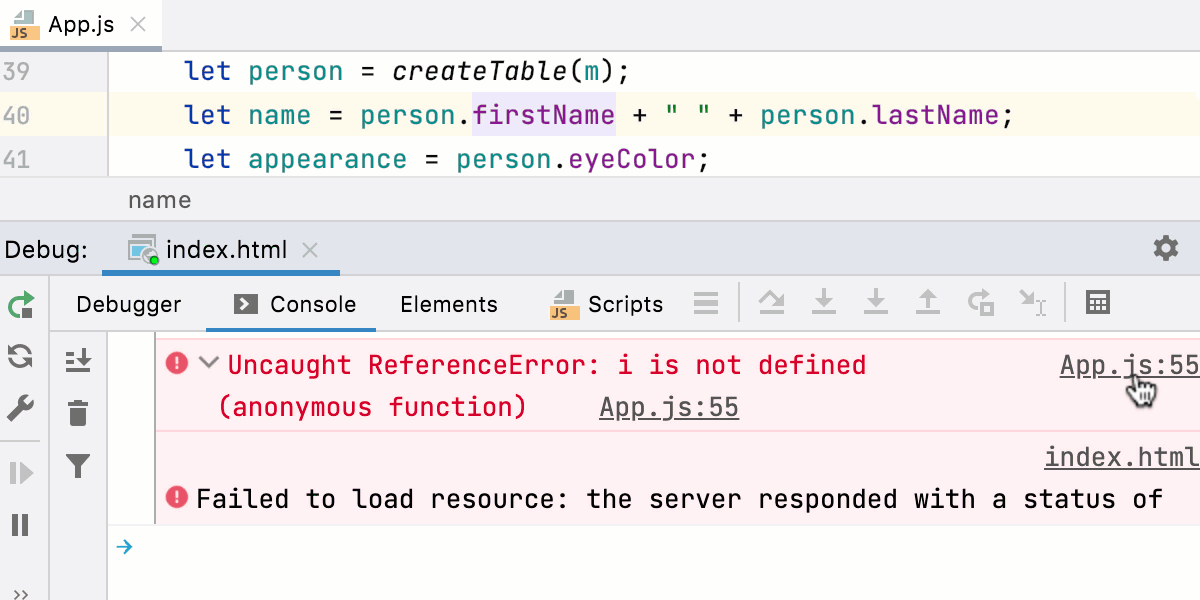
GifThe Console also shows stack traces. Click the link next to a reported problem to jump to the line of code where this problem occurred.
 Gif
Gif
Filter out messages
To hide log messages of specific types, click
 and select the severities to filter out.
Group messages
The log messages grouped using
console.group()andconsole.groupEnd()are displayed as a tree. To show the output collapsed by default, useconsole.groupCollapsed().
Apply CSS styles
Use CSS and the
%cmarker to apply styles to log messages.
See Styling console output with CSS for details.