Work with coverage results
Last modified: 05 December 2022No matter what type of coverage analysis you perform, coverage of unit tests, or coverage of an application, dotCover saves coverage results in a coverage snapshot. You can then further investigate these results using the editor and the Unit Tests Coverage window.
Visualize code coverage in the editor
After you finish a coverage session, Rider will open the Unit Tests Coverage window.
Click Highlight code
.png) on the toolbar of the window.
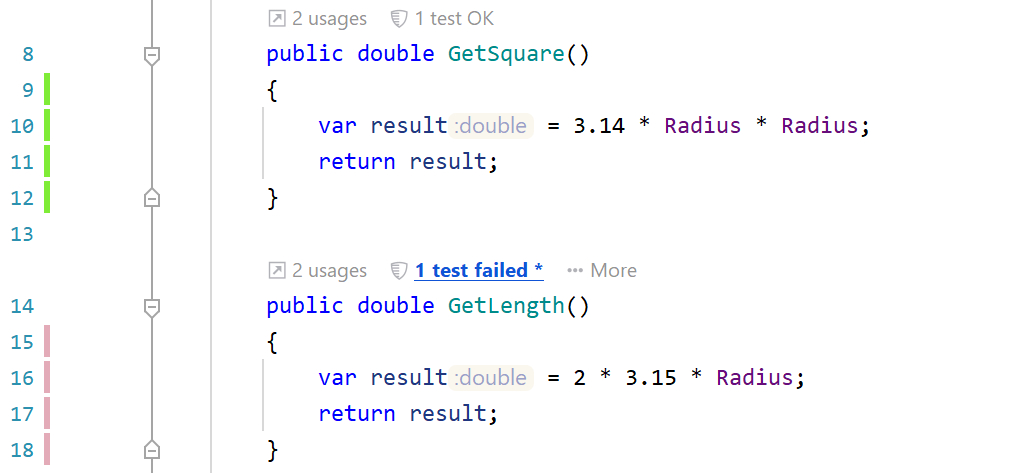
on the toolbar of the window.dotCover will highlight code in all assemblies that are included in the current coverage snapshot (see the gutter). If you have Code Vision enabled, dotCover will also show you the number of failed and successful tests:

To indicate the state of the code statement, dotCover uses colored markers in the gutter:
Marker | Description |
|---|---|
| At least one statement in a line is not covered by unit tests. |
| All statements in a line are covered by unit tests. All tests pass. |
| All statements in a line are covered by unit tests. At least one test fails. |
tip
If you want the highlighting to show only code coverage, clear the Use highlighting to show unit test results option in Settings | Build, Execution, Deployment | dotCover | Highlighting.
If you enable the Use shaped markers (colorblind mode) setting in dotCover's highlighting settings, markers will indicate coverage and test results not only with color but also with their shape.
Right after you change the code, test results become outdated. In this case, a marker keeps its color but it becomes paler. The marker's tooltip shows the info about previous state as well:

Quick view of coverage results in the current document
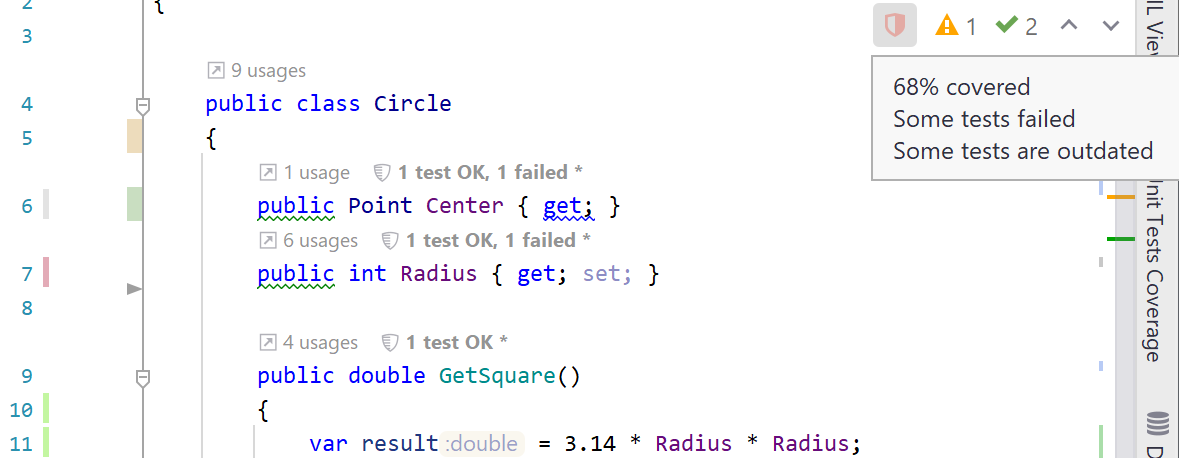
In addition to code highlighting, dotCover shows a shield icon in the top right corner of the current document. Hovering the icon lets you see the code coverage details. Clicking the icon navigates you through the uncovered statements.

The context menu of the shield icon provides more options, for example, Show Covering Tests lets you view the covering tests for the opened document.

Navigate to covering tests
Option 1
In the editor, place the caret at a code statement.
Make sure the highlighting is enabled and hold the cursor on a particular highlighting marker until a tooltip appears. Then click the tooltip.
In the popup that appears, you will see the list of unit tests that cover the statement.

Double-click the desired unit test to open it in the editor.
Option 2
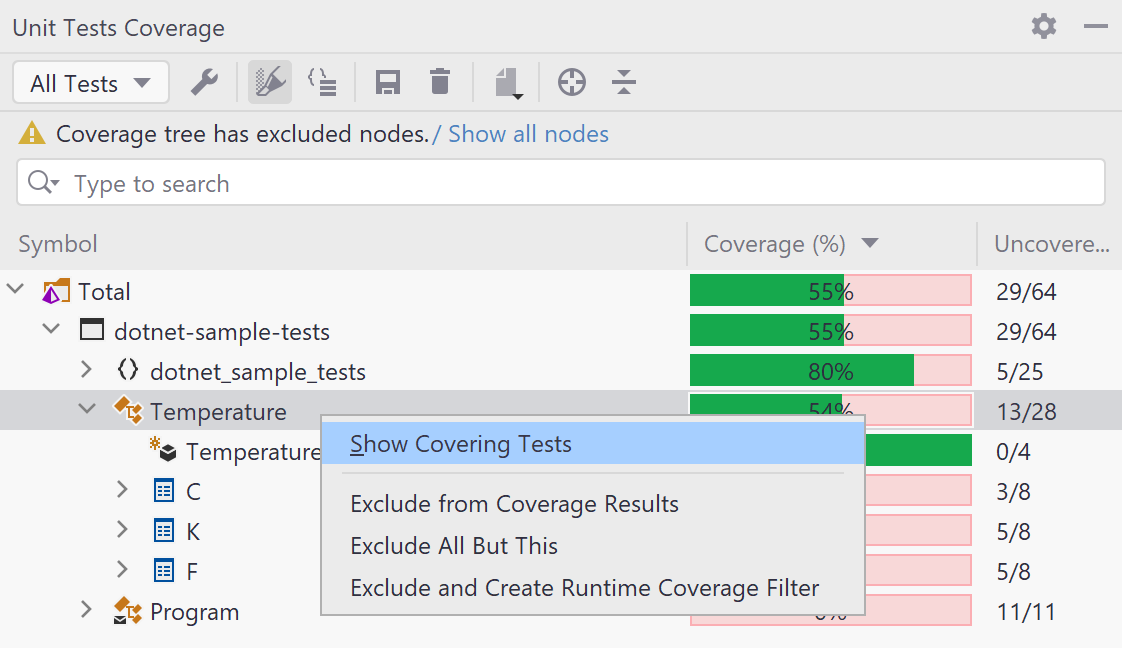
In the Unit Tests Coverage window, find the required class or class member.
In the context menu, select Show Covering Tests.

Navigate from a code symbol to the coverage tree
When working in the editor, you can quickly locate code symbols (types, methods, and so on) in the code coverage tree. This may be helpful if you want to see how well a code symbol is covered in the current snapshot.
In the editor, place the caret at a code symbol that you want to locate in the coverage tree.
In the Unit Tests Coverage window, click Navigate from Editor
 .
.The symbol will be located in the current tree.
tip
The reverse navigation is available by double-clicking on items in the coverage tree.
Search the coverage tree
The coverage tree displayed in the Unit Tests Coverage window provides a quick-search option for all items included in the tree.
tip
Quick-search in coverage tree supports CamelHumps (identification of compound names composed according to CamelCase, where each part starts with a capital letter) and the asterisk wildcard.
Open the Unit Tests Coverage window.
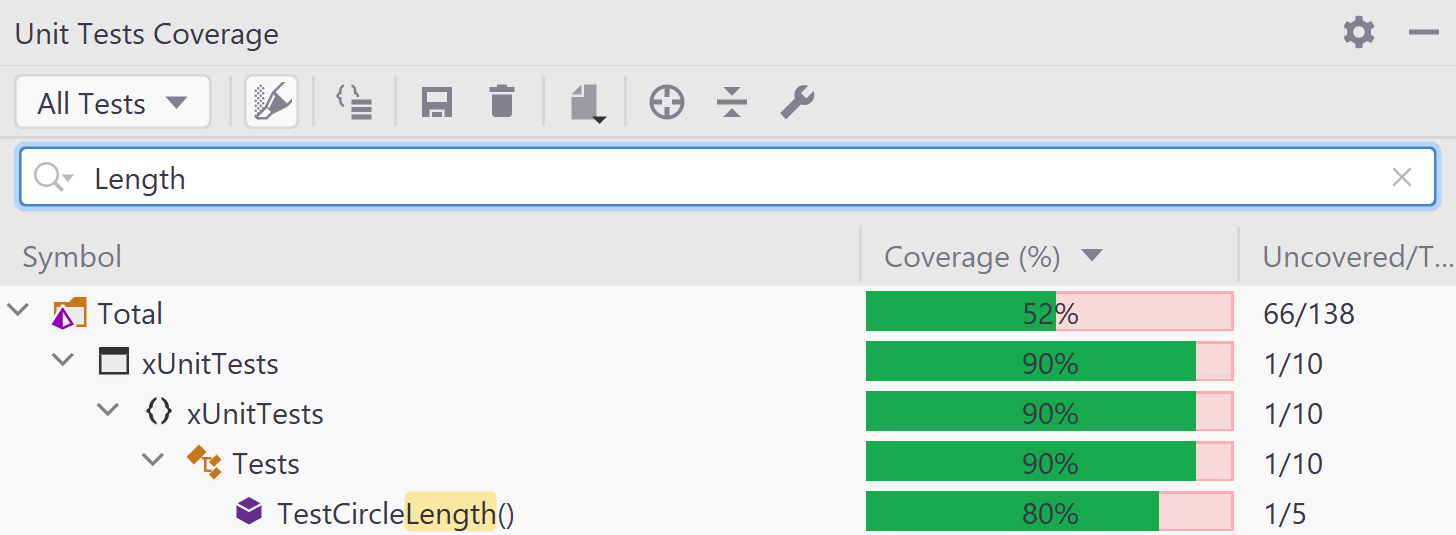
In the search field, start typing your search string.
Start typing a search string.
The Search box will appear under the toolbar displaying your search string and the coverage tree will be filtered according to the search string.

Note that applying search filters does not recalculate total coverage.
Export coverage results
dotCover helps process coverage data the way you need. Exporting to several formats, including HTML, XML, JSON, and XML for NDepend enables you to share coverage reports with the rest of the team or pass coverage information to external services.
In the Unit Tests Coverage window, click Export coverage report
 .
.In the list that opens, choose a format for export.
In the dialog that appears, specify a filename and location to which the report should be saved.