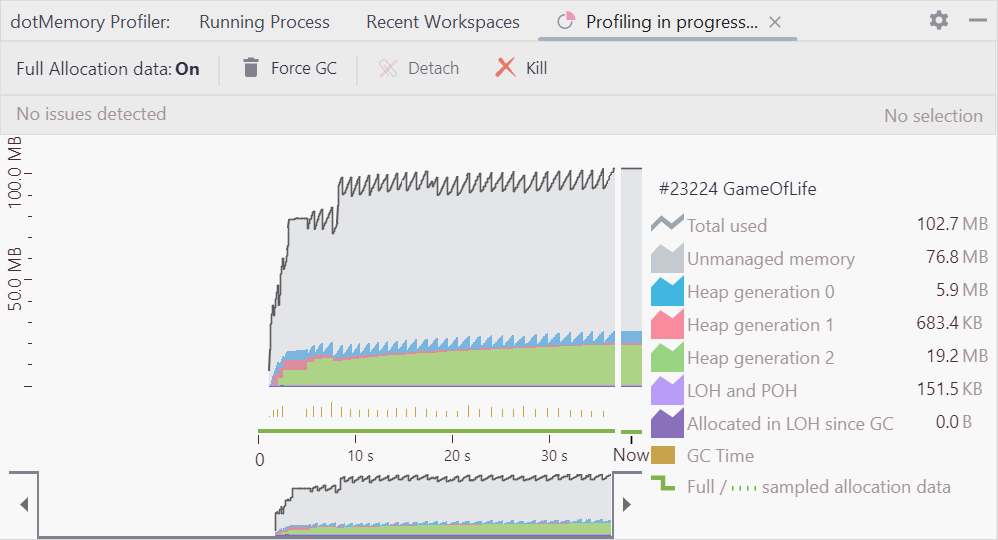
dotMemory Profiler window
Last modified: 31 July 2022View | Tool Windows | dotMemory Profiler
This window allows you to profile and analyze memory issues in .NET applications.
The dotMemory Profiler is a multi-tab window consisting of:
The Recent Workspaces tab used to open collected workspaces.
The Profiling tab used to control a profiling session.
Recent Workspaces tab
The Recent Workspaces tab is used to open previously collected workspaces. The tab contains a table with four columns each showing the corresponding workspace parameter: Last Opened, Name, Created, and Size.
To open a workspace, double-click it.
Profiling tab

After you start a profiling session, the dotMemory Profiler window will be opened on the Profiling tab. The tab allows you to manually control the session using the buttons on the toolbar:
Toolbar Controls
Control | Name | Description |
|---|---|---|
- | Full allocation data | Choose between collecting full (On) or sampled (Off) memory allocation data. |
Force GC | Force full garbage collection. | |
Detach | Detach All | Detach dotTrace from the profiled process | processes, but keep the process(es) running. Not available when using the Tracing or Line-by-line profiling types. The snapshot is not taken. | |
Kill | Kill All | Kill the profiled process | processes. The snapshot is not taken. |
.png)

