Analyze profiling results
When an application runs too slowly, it can be difficult to locate a problem and understand which action to take. Thus, the next step after profiling an application and getting a performance snapshot is opening the snapshot and analyzing data.
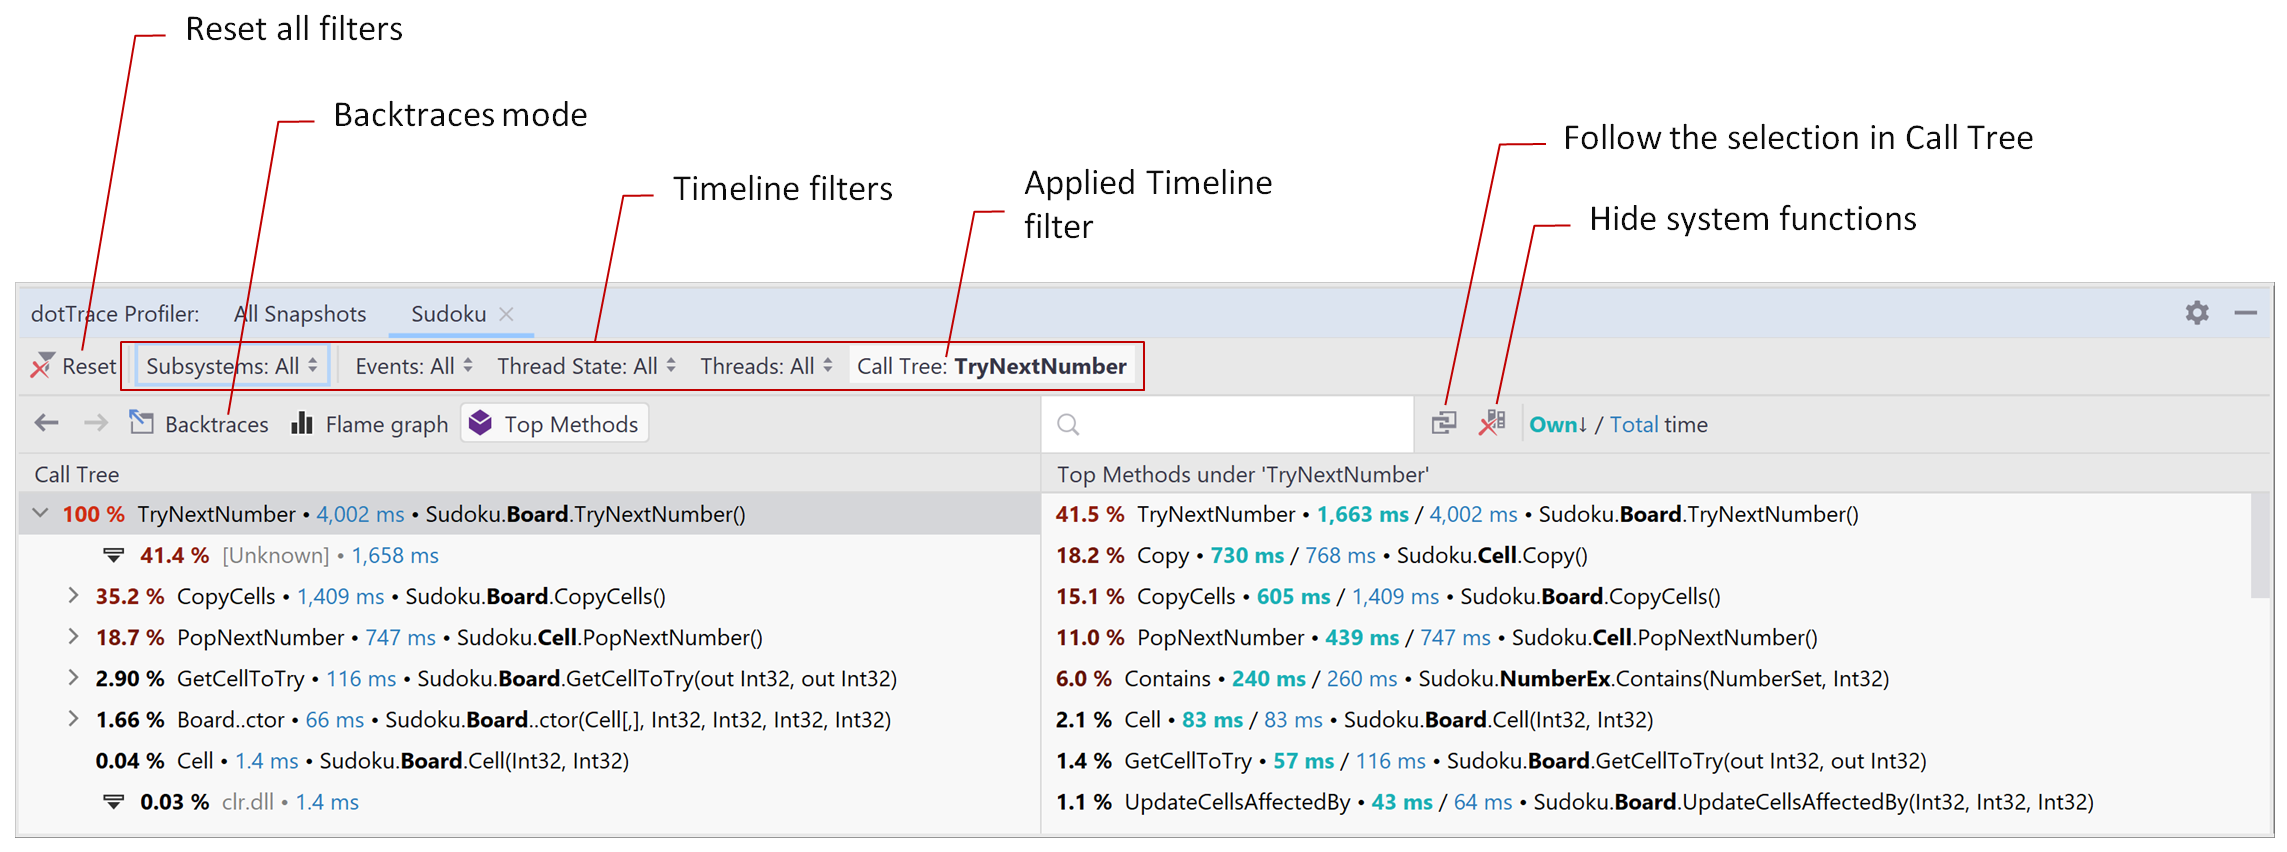
Typically, the final goal of any performance analysis is determining a particular method that causes performance issues. To help you perform this task, the dotTrace Profiler window offers two views: Call Tree and Hotspots.

Hotspots
Hotspots shows the list of methods from all selected threads sorted by execution time. Use Hotspots to determine the slowest methods in particular parts of the Call Tree.
Top Methods is a counterpart of the Methods and Subsystems view it dotTrace standalone. For all topics on how to work with Top Methods, refer to the dotTrace documentation.
Call Tree
Call Tree shows method execution paths. Each method node in the tree represents a top-level method executed by a certain thread. The method node lists methods it called and metrics collected during profiling.
You can also switch the call tree to the Flame Graph mode: each bar on the graph represents call's total time. This lets you quickly find the slowest call chains.
Call Tree is a counterpart of the Call Tree view in the standalone dotTrace version. For all topics on how to work with Call Tree, refer to the dotTrace documentation.
Filter data in Timeline snapshots
Timeline snapshots have additional data on how the calls are distributed in time. This allows you to perform much more complex time interval analysis: for example, you can leave only the intervals where UI freezes took place, or time intervals with blocking GC, and so on. For the detailed information about Timeline filters, refer to the dotTrace documentation.
The filters that are currently applied to the opened snapshot are shown on the top of the dotTrace Profiler window. To remove all filters at once, click Reset.
Apply a filter by event
dotTrace collects various application data: garbage collection and file operations intervals, memory allocation data, data on raised exceptions, and so on. Selecting an event from the list of Events may be a good starting point for further analysis. For example, to see which methods allocate memory in your application, turn on the .NET Memory Allocations filter. For more information about events, refer to the dotTrace documentation.
Apply an interval filter (UI Freeze, Incoming HTTP Requests, and Tasks)
The idea of interval filters is "Select all time intervals where a certain event takes place". For example, if you want to analyze the cause of UI freezes, you can leave only time intervals where freezes took place by turning UI Freeze on. The difference between Events and interval filters is that you can apply multiple interval filters at once (time intervals selected by interval filters may overlap within one thread). For more information on interval filters, refer to the dotTrace documentation.
Apply a filter by thread
By default, Call Tree shows you an aggregated tree containing all method calls from all threads: Threads: All. To apply a filter, select a thread in the list. After this, the Call Tree (and Top Methods as well) will show you methods only from the selected thread.
Apply a filter by thread state
The idea of the Thread State filter is to 'Select all time intervals where threads were in the specified state: either running or waiting'. To apply the filter, select a state in Thread State.
Apply a filter by method
Sometimes, you may want to focus on a particular method in the call tree. To do this, select the method in the Call Tree or Top Methods and in the context menu, choose Merge All Method Occurrences. After this, the selected method becomes the root node in Call Tree containing all the occurrences. All other calls are hidden.
Apply a filter by subsystem
The Subsystems filter allows you to quickly evaluate how time in a particular call tree is distributed among various components: user and system code, WPF, LINQ, File I/O, collections, and more. To apply the filter, select a subsystem in Subsystems. For more information about subsystems, refer to the following topic.
Navigate from source code to a snapshot
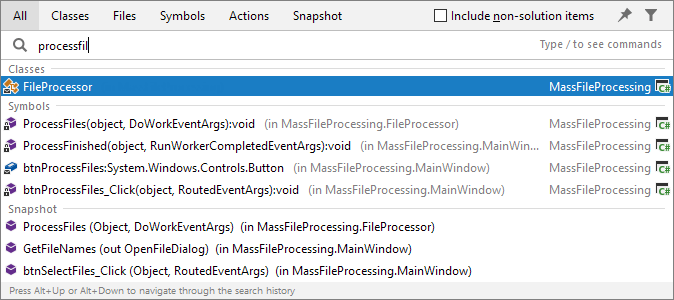
Note that you can navigate not only from a snapshot to code, but also from code to the snapshot. The Search Everywhere command Control+N, G allows searching for a method not only in code but also in opened performance snapshots. For this purpose, the resulting list of suggestions contains the Snapshot category. After you select a method under this category, Rider will navigate you to the corresponding method occurrence in the dotTrace Profiler window.

The Navigate To feature also supports navigation to performance snapshots: in the editor, place the caret at a method and press Control+Shift+G, then select Show in Performance Snapshot.
Work with snapshots
All collected snapshots are shown on the All Snapshots tab of the dotTrace Profiler window. Here you can open snapshots for analysis, delete them, or save them in the .dtp (.dtt) format for exporting to other computers.
Open a snapshot
(Optional) If you're interested only in the snapshots for the currently opened solution, in the All Snapshots tab, click
.
In the All Snapshots tab, select the desired snapshot.
Do one of the following:
Double-click the snapshot.
In the context menu, select Open.
This will open the snapshot in a separate tab in the dotTrace Profiler window.
Export a snapshot
(Optional) If you're interested only in the snapshots for the currently opened solution, in the All Snapshots tab, click
.
In the All Snapshots tab, select the desired snapshot.
In the context menu, select Export.
Specify path and filename and click OK.
Open an exported snapshot
In the All Snapshots tab, click
 .
.Specify path to the snapshot and click OK. The snapshot will be added to the All Snapshots list.