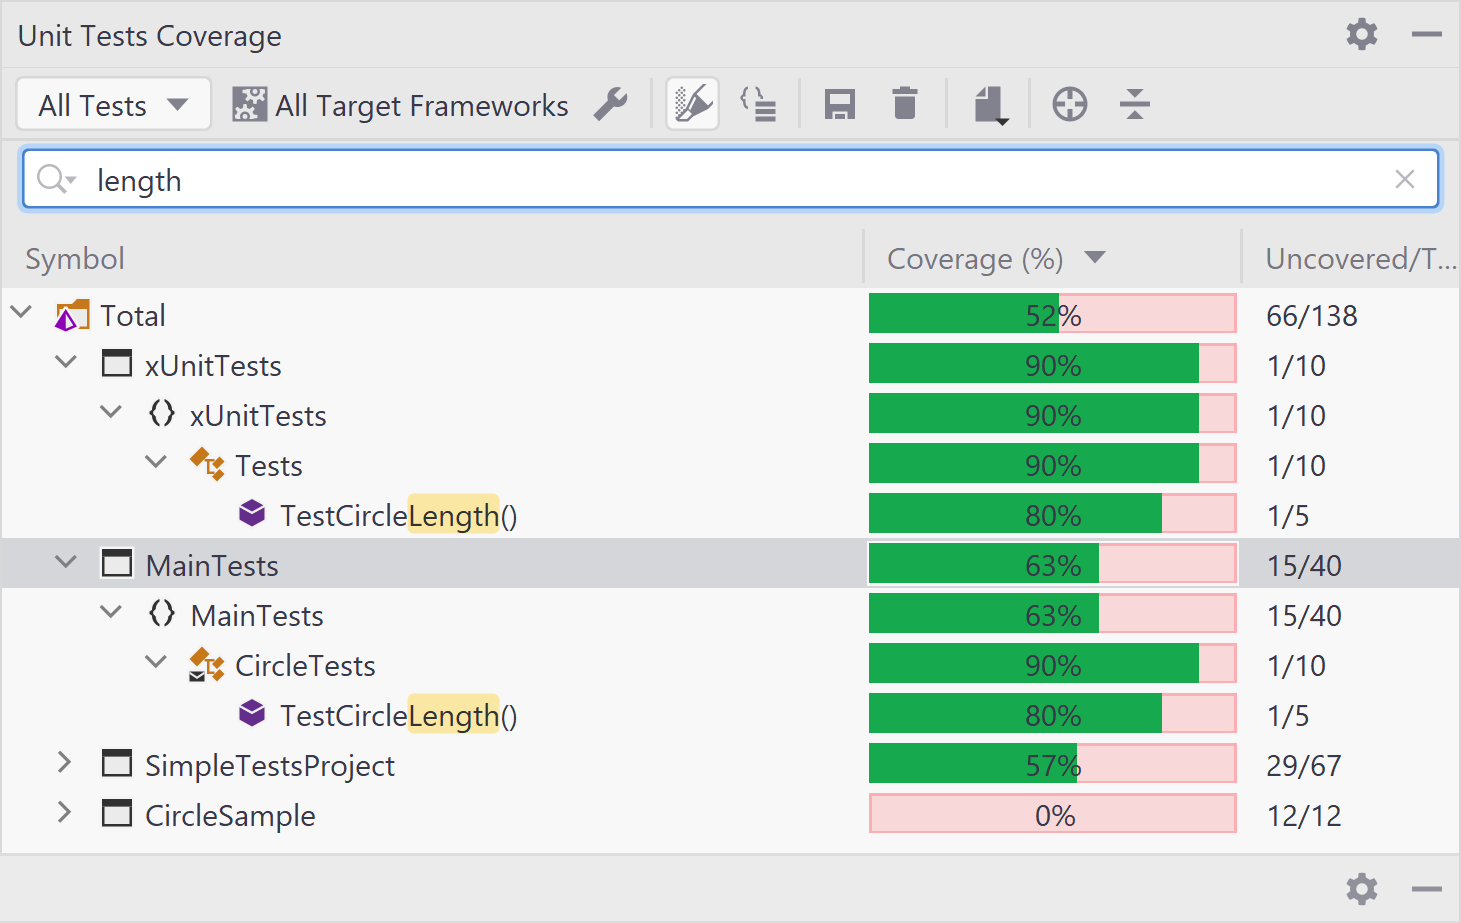
Unit Tests Coverage window
Enable the dotCover plugin
This functionality relies on the dotCover plugin, which is bundled and enabled in JetBrains Rider by default. If the relevant features aren't available, make sure that you didn't disable the plugin.
Press Control+Alt+S to open the IDE settings and then select .
Open the Installed tab, find the dotCover plugin, and select the checkbox next to the plugin name.
This window allows exploring coverage data obtained during unit tests coverage run. The window shows all code items from a coverage snapshot in a tree structure allowing you to inspect coverage of each item.

In the Coverage column, dotCover uses three colors to display the coverage status:
Green: the percentage of covered statements within the node.
Red: the percentage of uncovered statements within the node.
Grey: the nodes not covered during the test run as they do not have executable code statements.
Toolbar Controls
Control | Name | Description |
|---|---|---|
All Tests | If selected, the tree shows aggregated coverage results from all unit test sessions. | |
All Tests in Active Session | If selected, the tree shows coverage results for all unit tests from the session that is currently selected in the Unit Tests window. | |
Selected Tests in Active Session | If selected, the tree shows coverage results for the test selected in the current session in the Unit Tests window. | |
All Target Frameworks | Filters coverage results based on the selected target framework. This list is shown only if your project targets multiple frameworks. | |
| Highlight code | Toggles highlighting of the code in the editor for the current coverage snapshot. For more information, refer to dotCover documentation. |
| Flatten Namespaces | Toggles between flat and tree namespace representation. In the flat mode, all namespaces including child namespaces are shown in a flat list (on the same level). |
Save coverage snapshot as | Saves the current snapshot to a .dcvr file. For more information, refer to https://www.jetbrains.com/help/dotcover/Saving_and_Loading_Coverage_Snapshot.html. | |
| Drop coverage results | Removes the existing coverage results. |
| Export coverage reports | Allows you to export the test coverage report to one of the selected formats: HTML, JSON, XML, XML for NDepend. |
| Navigate from Editor | Navigates you from a selected symbol in editor to this symbol in the coverage tree. |
