Attach to process
JetBrains Rider provides a way to attach the debugger to both local and remote processes.
The steps to attach to a process depend on how and where the process was launched.
While JetBrains Rider debugger is capable of attaching to any .NET or .NET Core process, it is recommended to prefer a simpler way when there is one. You don't want to attach to a 'hello world' running on the same machine.
Attach to a local process
Press Control+Alt+F5 or select from the main menu.
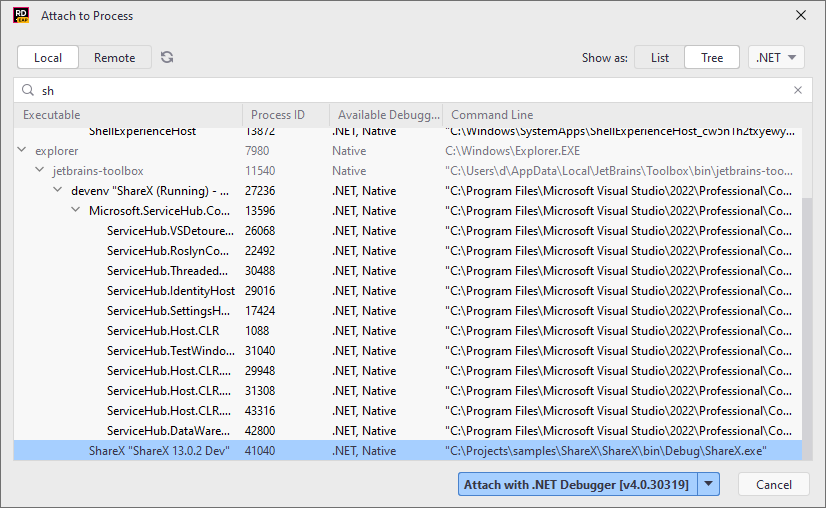
JetBrains Rider will show the list of the running local processes. Select the process to attach to.
If necessary, narrow down the list of processes by typing the first letters of its name or PID. If the target process was started after you'd opened this dialog, you may need to click Refresh
.

If you don't know the name or ID of the desired process, try the following:
Click Show as: Tree on the toolbar and start with expanding the parent process nodes.
Select a specific debugger in the top-right corner of the dialog. For example, if you are debugging a .NET process, select .NET to hide all native and JVM processes.
To connect to the process with the default debugger, press Enter. If there are several debuggers that can be used for the process, you can choose the debugger with the selector in the bottom-right corner of the dialog.
If you don't have sources of the target .NET process, you can still attach to it either as described above or by clicking Attach to Process on the Welcome screen, right after you start the IDE. JetBrains Rider will automatically load and decompile all assemblies from the process.
To get a proper starting point for debugging the target process, you can search for types in the loaded assemblies and set breakpoints in the decompiled code.
Attach to recent processes
All processes that you have attached to in the current session are listed in the Recently attached section at the top of the Attach to Process dialog, so you can easily return to processes that you worked with.
JetBrains Rider will list recent processes even if they were terminated and then relaunched with a different PID.
You can attach again to the very last process that you have attached to, even without opening the dialog. To do so, press Control+Alt+Shift+F5 or choose from the main menu.
Attach to a remote process
Debugging a remote process (usually, a Web application running on a remote host), is a completely different scenario, which requires setting up the debug agent on the remote host and configuring the connection before actually attaching to the target process. All those steps are described in the Debug remote applications via SSH tutorial.
Detach from a process
The procedure of detaching from a remote process is the same as for stopping a local debug session, however, the effect is different. When you detach, the debugging session closes but the process continues to run.
Click the Stop
button on the main toolbar on in the Debug window.
Alternatively, click Stop
on the main toolbar or press Control+F2, then select the session to be closed.