Compare Snapshots
Comparing snapshots taken within one session is a useful technique that gives a direct answer on a question "What objects cause a memory leak in my app?" The idea behind comparing snapshots is quite simple: you take two snapshots, one of which is used as a basis for comparison (it is always the one that was taken earlier).
The Comparison view provides details on how many objects were created between snapshots and how many objects were collected. If a class should not have new instances, but it does, than it is, probably, the cause of the leak.
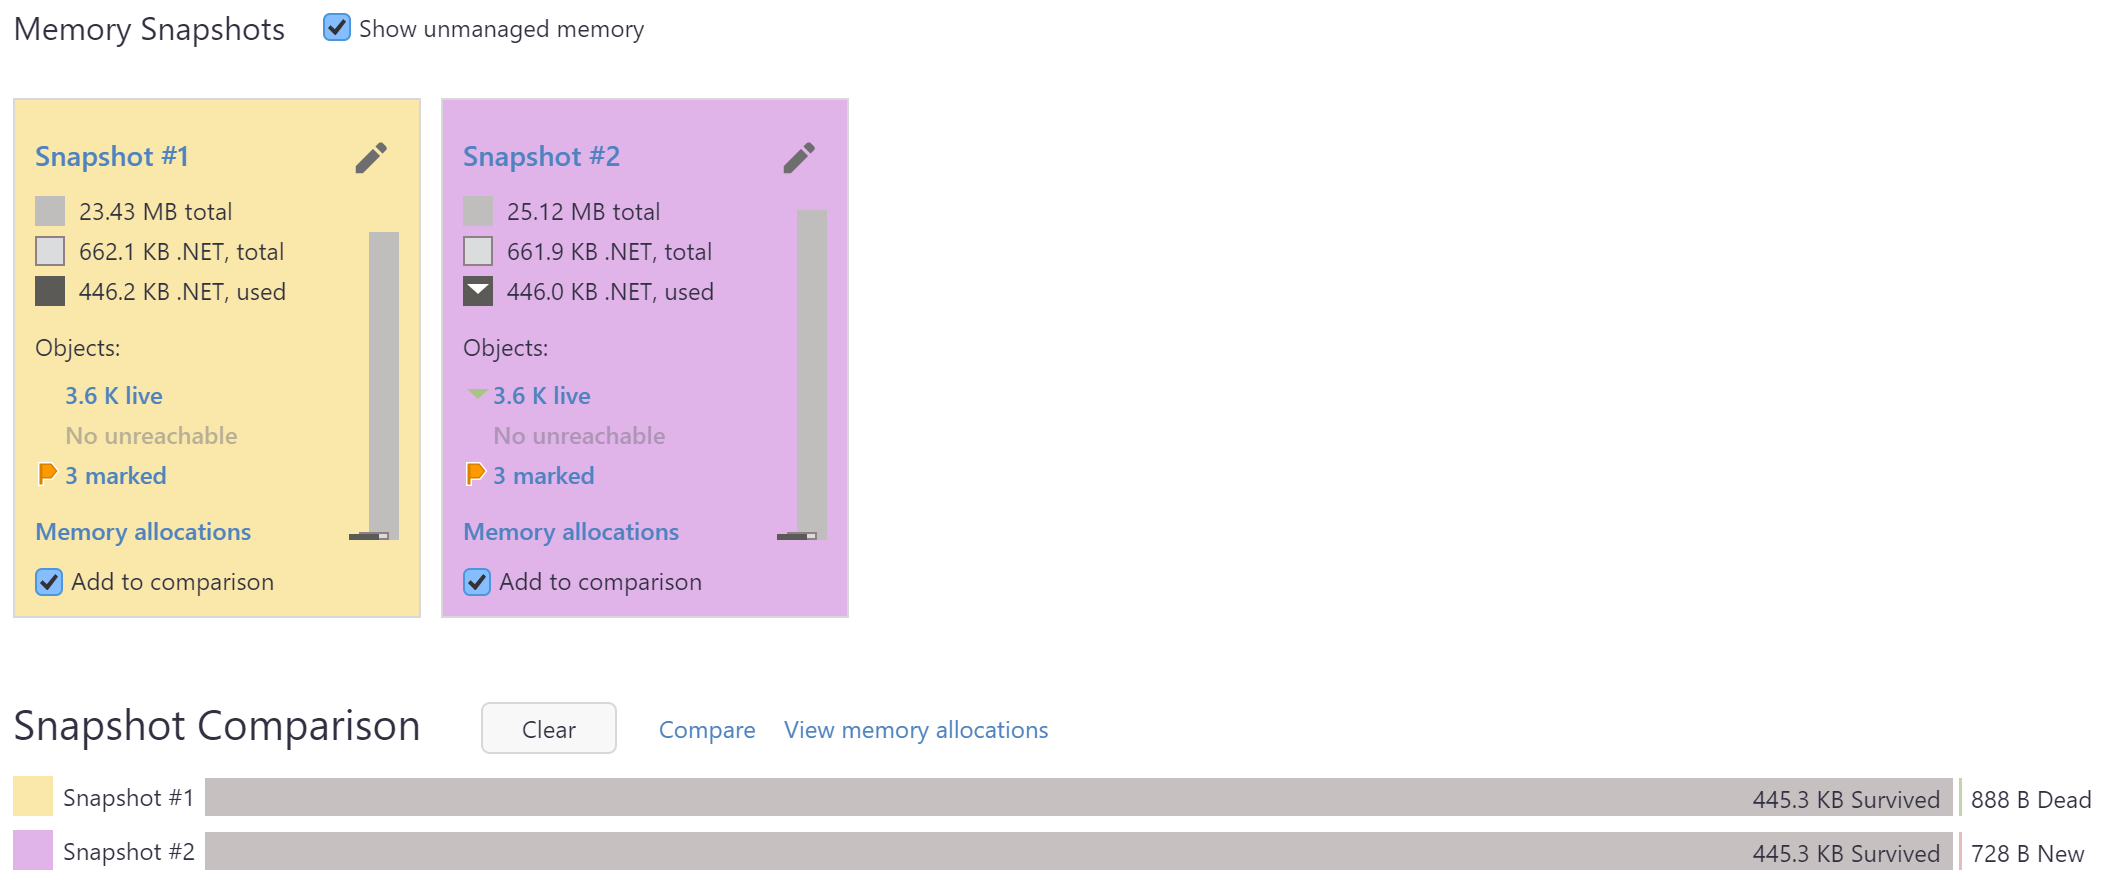
Start a profiling session and collect at least two snapshots. After the profiling session is finished, dotMemory will open the Analysis page.

Click Add to comparison for each snapshot you want to compare.
Click Compare in the comparison area. After this, dotMemory will open the Comparison view for the snapshots.
Using the Comparison view, analyze the comparison data.
The Comparison view shows data in a list with the following columns:
Name | Description |
|---|---|
Type | Type name. |
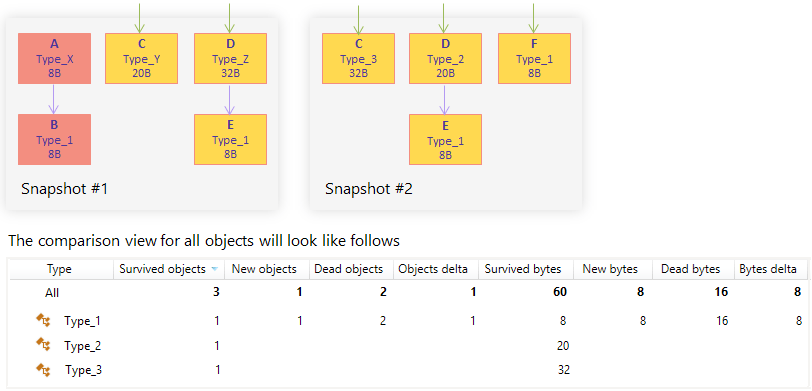
Survived objects | The number of instances that exist in both snapshots. |
New objects | The number of new instances that were created between snapshots. |
Dead objects | The number of instances that existed in the base snapshot but were collected by the moment of taking a second snapshot. |
Objects delta | The difference between the number of new and dead objects. |
Survived bytes | The overall size of survived objects in bytes. |
New bytes | The overall size of new objects in bytes. |
Dead bytes | The overall size of dead objects in bytes. |
Bytes delta | The difference between the size of new and dead objects. |

For convenience, you can group the list in four different ways:
- Plain List
Object sets are displayed in a plain list. This is the easiest way to identify objects with the highest memory usage.
- Group by Interface
Object sets are grouped by interfaces they implement. If an object implements more than one interface, it will be displayed under each implemented interface.
You can filter out object sets that are of no interest for your analysis.
Start typing the desired type name in the Filter field.
JetBrains Rider will exclude all objects that don't match the pattern.
In the Comparison view, you can select the following subjects for further analysis:
Survived objects;
New objects;
Dead objects.
Click the number in Survived objects/New objects/Dead objects against the desired type name.
In the opened dialog, select a snapshot where you want to analyze the object set.
After this, the Survived/New/Dead [type_name] subject will be added to the analysis path on the left and the list of desired objects will be displayed in the Group by Types view.