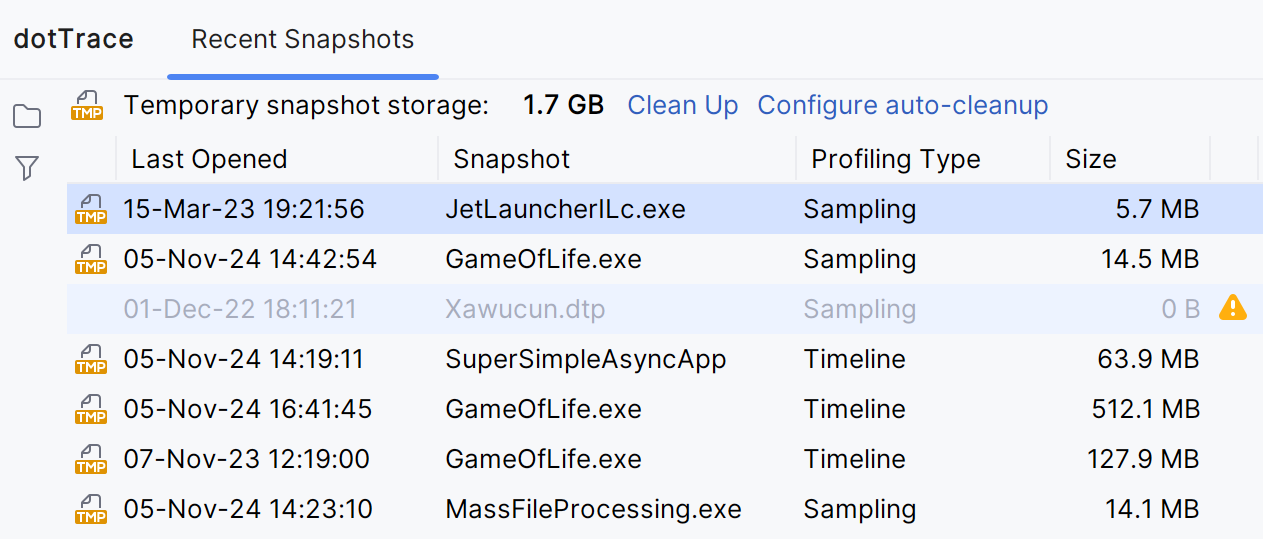
dotTrace Profiler window
This window allows you to profile and analyze performance bottlenecks in .NET applications.
The dotTrace Profiler is a multi-tab window consisting of:
The All Snapshots tab used to open collected snapshots
The Profiling tab used to control a profiling session.
Analysis tabs used to analyze collected performance snapshots.
Recent Snapshots tab

The Recent Snapshots tab shows the list of recent snapshots. To open a snapshot, double-click it.
Profiling tabs

After you start a profiling session, the dotTrace Profiler window will be opened on the Profiling tab. The tab allows you to manually control the session using the buttons on the toolbar:
Toolbar Controls
Control | Name | Description |
|---|---|---|
| Start Recording | Start collecting performance data. If you see this button right from the session start, then you have not selected the Collect profiling data from start checkbox in the profiling options. |
| Get Snapshot | Generate a snapshot and stop collecting performance data. |
| Restart | Discard the collected performance data and restart collecting. |
| Detach | Detach All | Detach dotTrace from the profiled process | processes, but keep the process(es) running. Not available when using the Tracing or Line-by-line profiling types. The snapshot is not taken. |
| Kill | Kill All | Kill the profiled process | processes. The snapshot is not taken. |
Important: the profiler will automatically get a snapshot if you close the profiled application or the application successfully finishes working.
The Profiling tab contains two lists:
The list of profiled processes on the left.
The list of collected snapshots on the right. The row marked with the
 icon indicates the currently collected data.