Predictive debugger
When you debug a program, you normally see its current state and can analyze code that has already been executed. So when you step into a function, you don't see what happens inside its body until you apply additional stepping actions.
With predictive debugger, you can see what happens after the current statement without any stepping. It executes the code in the background and provides you with the following insights:
Forecast and display the results of boolean expressions.
Visually 'mute' parts of the method that will not be executed.
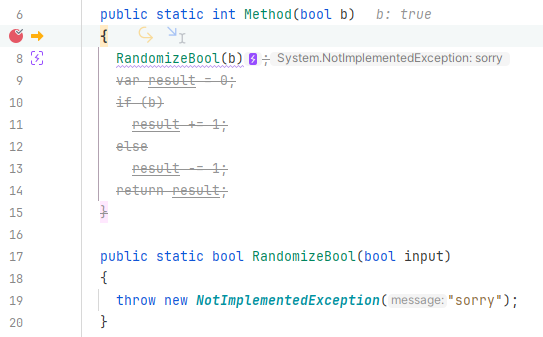
Warn you that further execution will end with an exception.
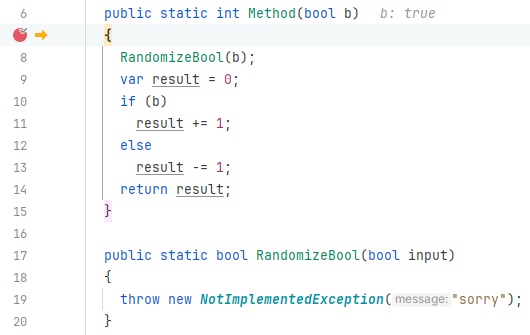
In the example below, predictive debugger helps you see at once that the method will not be executed beyond the RandomizeBool() call because it will throw a NotImplementedException.
Predictive debugger is disabled | Predictive debugger is enabled |
|---|---|
 |  |
Predictive debugger is enabled by default, but you can disable it by clearing the Enable debugger data flow analysis checkbox on the page of JetBrains Rider settings Ctrl+Alt+S.
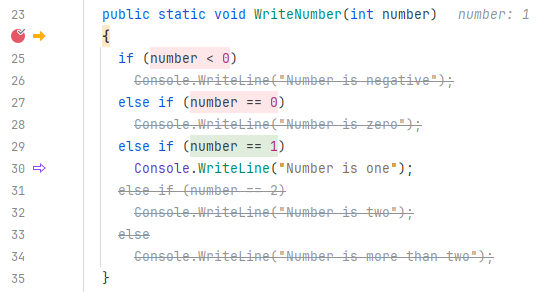
Predictive debugger can visualize function execution in two different ways. By default, in the Colorized mode, boolean expressions that evaluate to true are highlighted in green, and those evaluating to false are highlighted with red; non-executable code is shown as strike-through text.
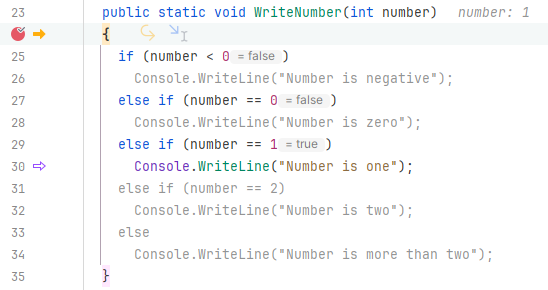
If you prefer not to rely on colors, you can clear the Enable Colorized Mode checkbox on the page of JetBrains Rider settings Ctrl+Alt+S. In this case, results of boolean expressions are shown as inline hints.
JetBrains Rider also calculates the statement that will be executed next in the current context and highlights it with the outlined arrow in the gutter:
Colorized mode | Colorized mode disabled |
|---|---|
 |  |
After stepping into a function, predictive debugger is performed in a limited timeframe, which is 3000 milliseconds by default. In complex functions, this may not be enough to analyze all execution paths; on the other hand, stepping speed may be affected. If necessary, you can increase or decrease the default timeout under Enable debugger data flow analysis on the page of JetBrains Rider settings Ctrl+Alt+S.