Debug tool window
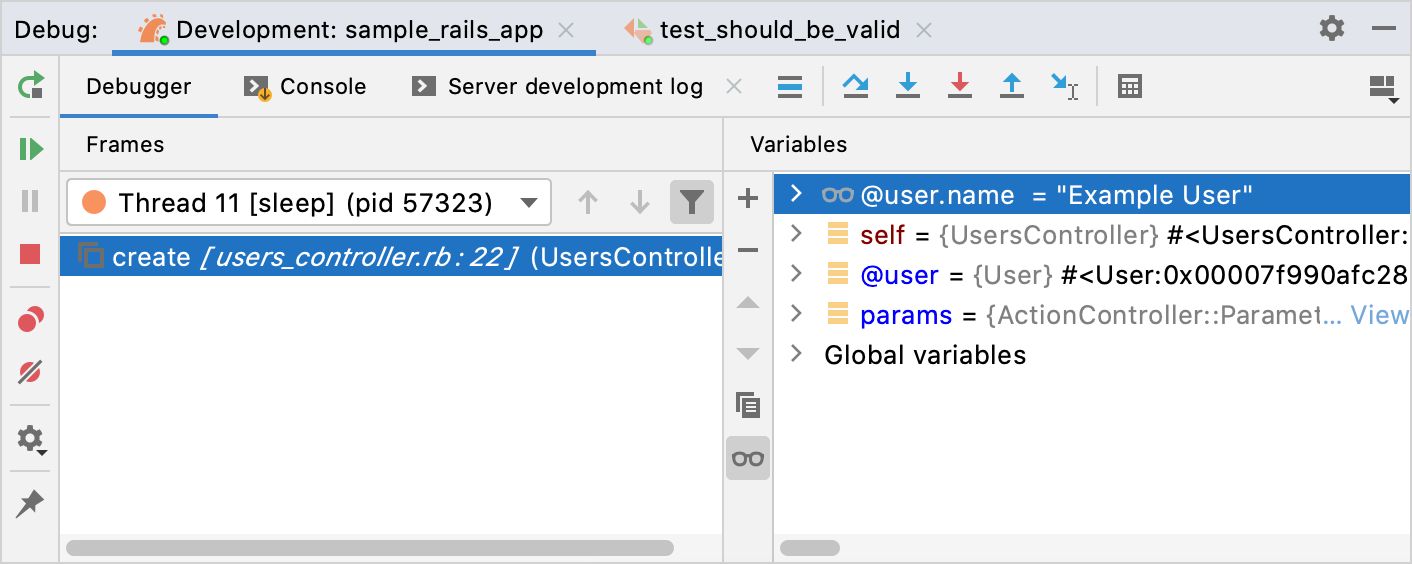
When you start a debugger session, the Debug tool window appears. Use this window to control the debugger session, display and analyze the program data (frames, threads, variables, and so on), and perform various debugger actions.

Sessions
The available debug sessions are separated into tabs in the top part of the Debug tool window.

If you enable Services window for specific run/debug configurations, the entire view of the Debug window will be displayed inside the Services window when you debug any of these configurations.
Tabs
Debug tool window shows the following tabs for each session:
Frames: lets you navigate in call stacks of the threads.
Variables: lists the variables available in the current context and lets you analyze and modify the program state.
Watches: lets you manage watches. By default, watches are shown on the Variables tab for more efficient use of the screen space. If you have a lot of watches, consider viewing them in a separate tab.
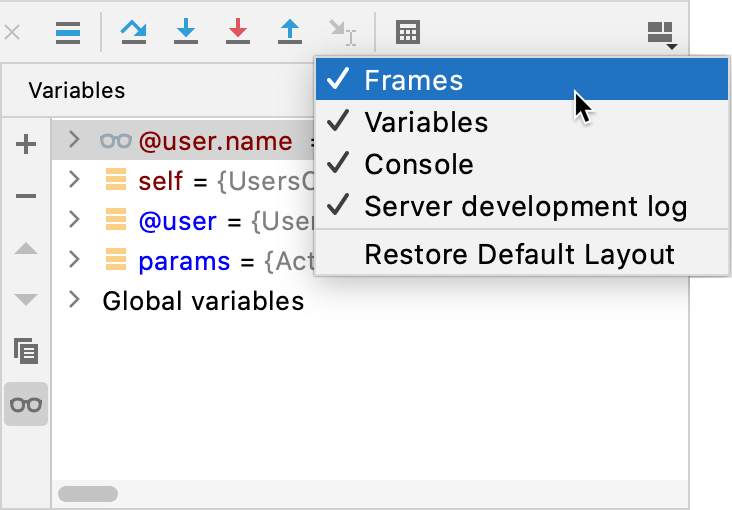
Show/hide tabs
Click
and select which tabs you want to see.

Restore default layout
If you changed the layout of the Debug tool window and don't like the new arrangement, you can revert it to the default state.
Click
in the top-right corner of the Debug tool window, then click Restore Default Layout.
Move tabs
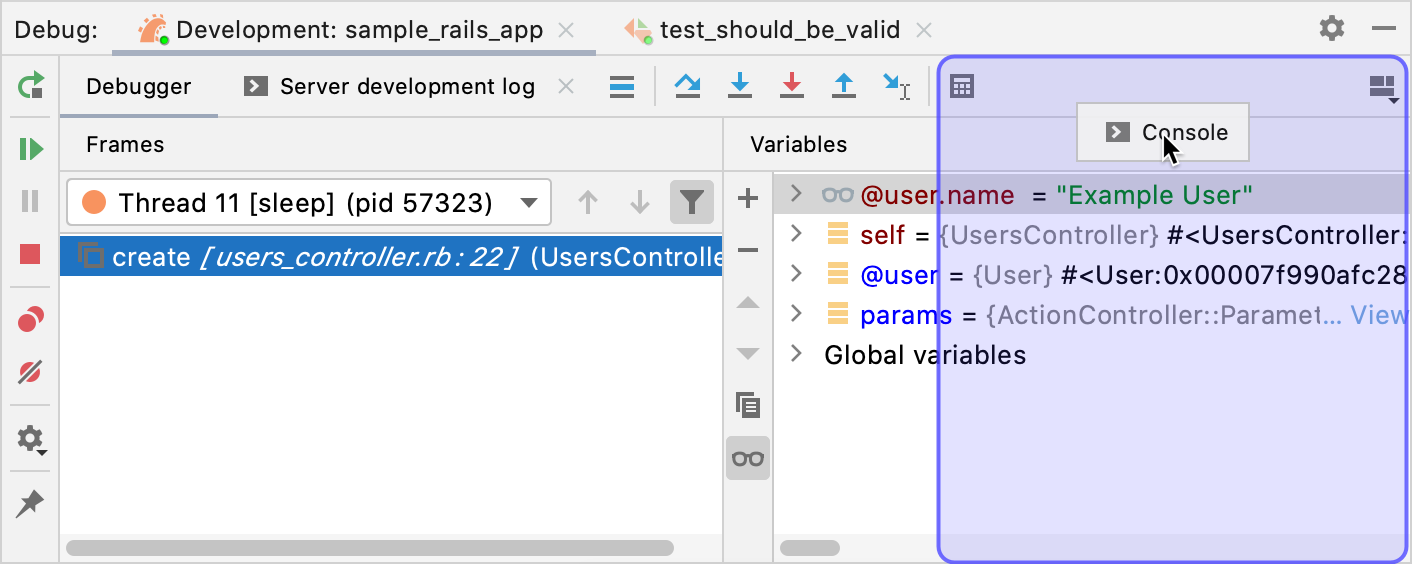
You can arrange the tabs to fit your preference. You can move a tab to another location or group a tab with another tab, so that they share the same space on the screen.
Drag the tab header to the desired location. The blue frame indicates the destination.
