Debug Oracle PL/SQL code
This functionality relies on the Database Tools and SQL plugin, which is bundled and enabled in RubyMine by default. If the relevant features aren't available, make sure that you didn't disable the plugin.
Press CtrlAlt0S to open the IDE settings and then select Plugins.
Open the Installed tab, find the Database Tools and SQL plugin, and select the checkbox next to the plugin name.
The debugger is based on the Oracle Probe that uses API of the DBMS_DEBUG package and should work on Oracle servers 9.0 and later.
In Oracle, you can debug the following program units (PL/SQL programs): anonymous blocks, packages, procedures, functions, and triggers.
Right-click the Oracle data source and select New | Query Console.
Alternatively, select one of the existing consoles from Query Consoles list (CtrlShiftF10).
Type or paste your code in the console.
Click the Execute button
or press CtrlEnter to run the procedure code.
As a result, you see a created object in the Database tool window ( View | Tool Windows | Database).

A code snippet of the procedure:
CREATE PROCEDURE simpleprocedure (inval NUMBER){...}
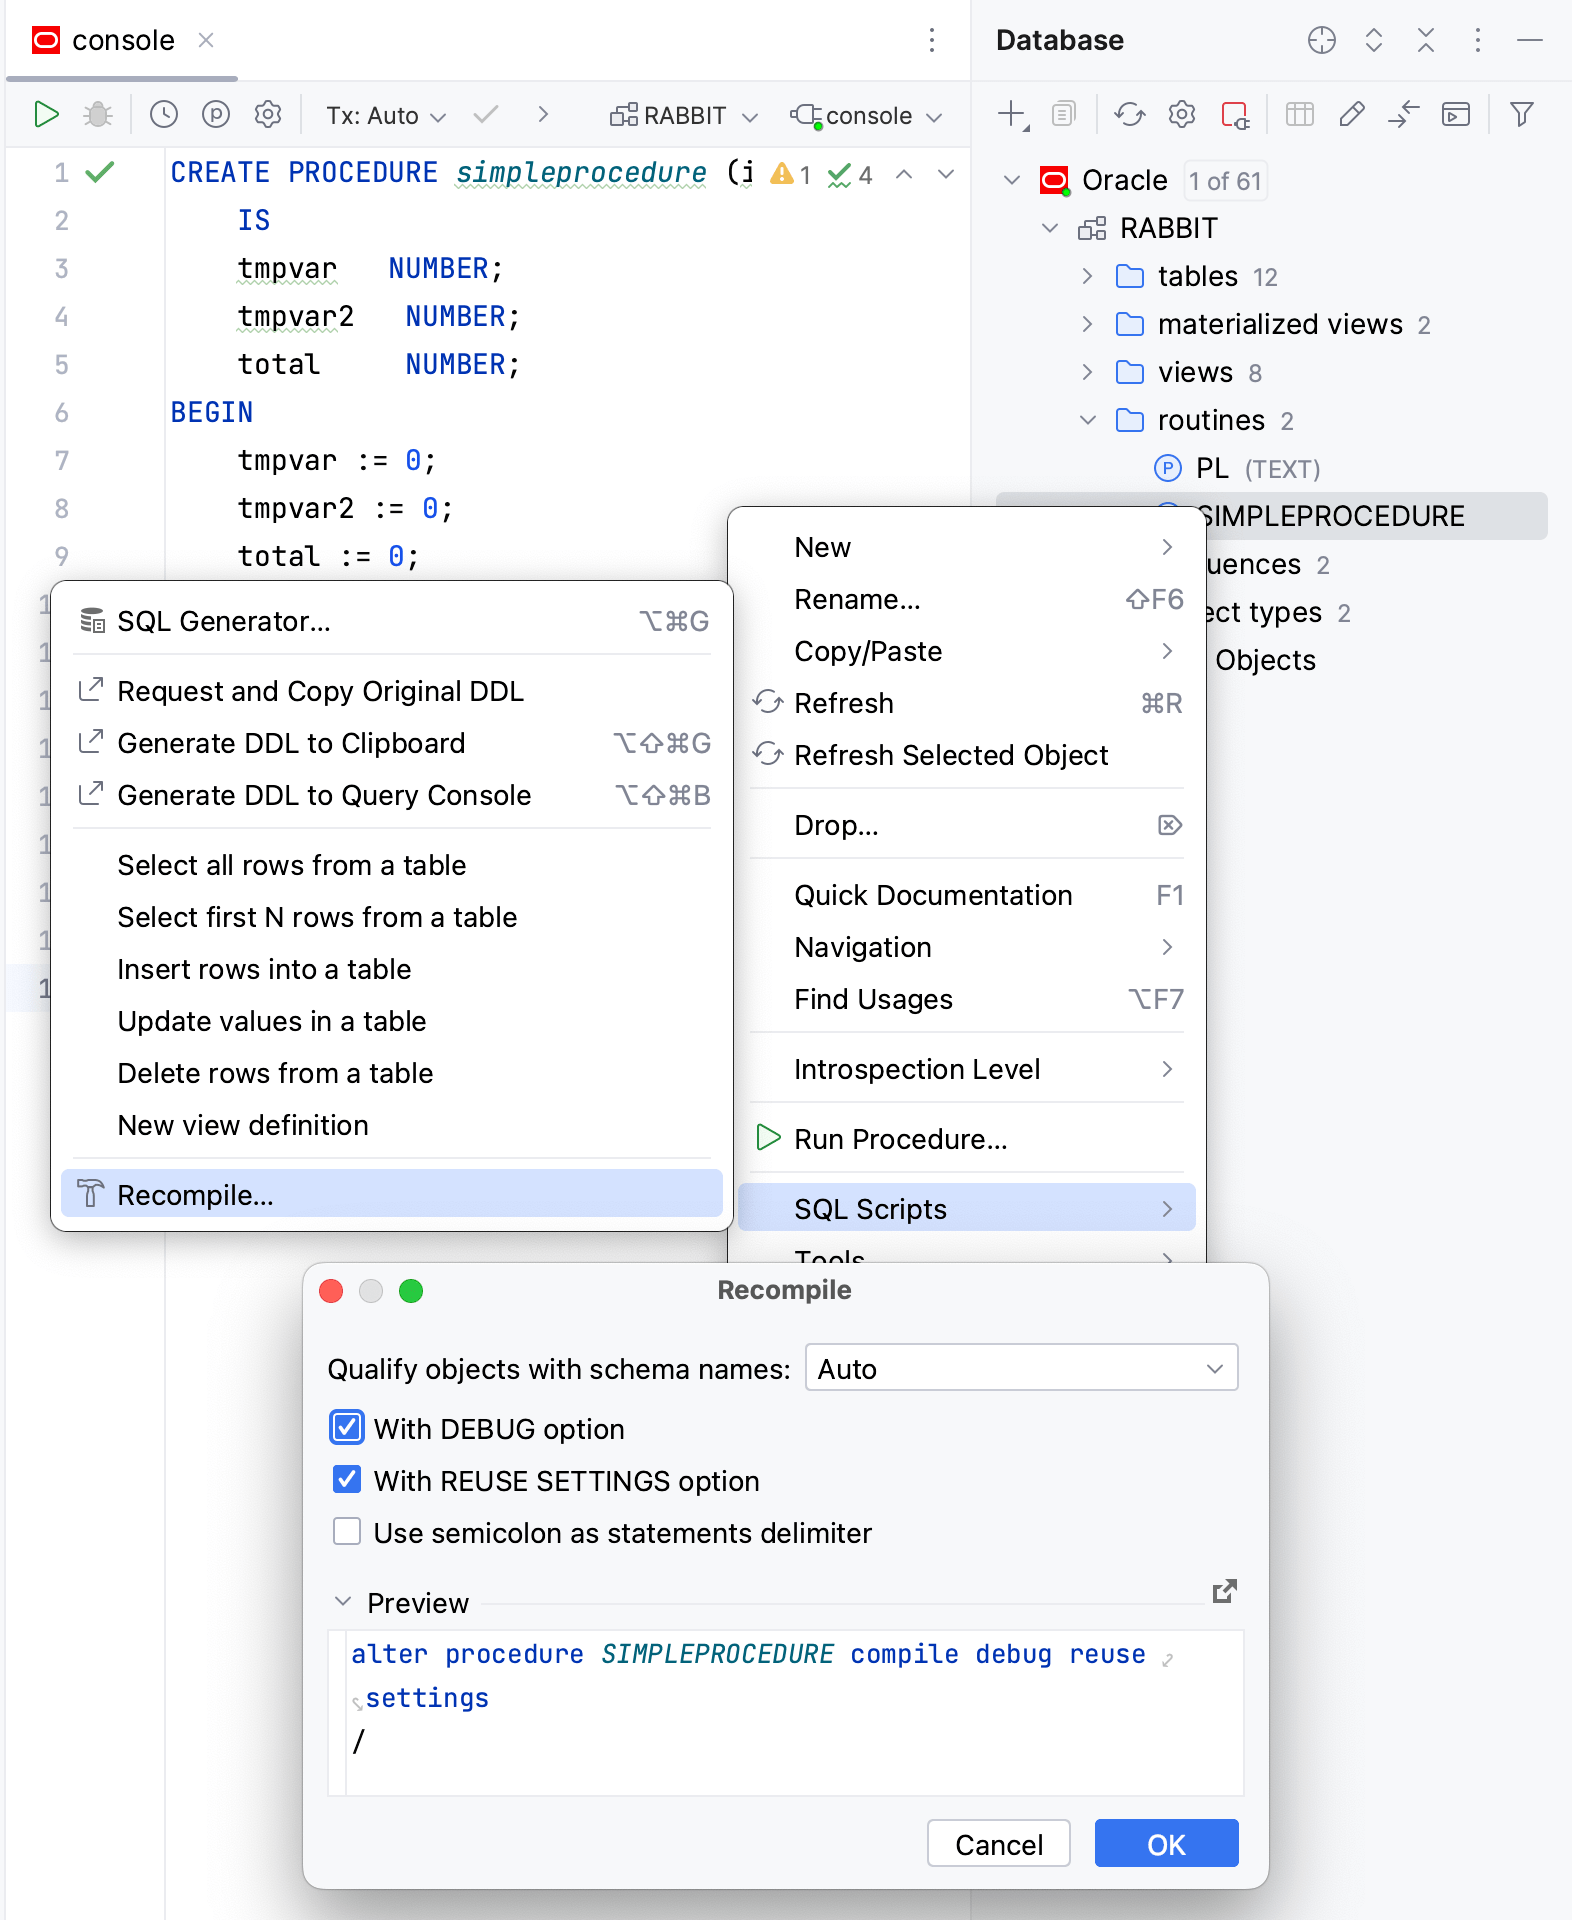
To enable debugging for a PL/SQL code, you need to compile it with the DEBUG option. The process of compilation converts PL/SQL code to Pro*C, which is then compiled to Oracle shared libraries. The compilation helps the Oracle interpreter to process your code faster.
Right-click the PL/SQL object that you want to debug and select SQL Scripts | Recompile.
In the Recompile dialog, select With DEBUG option.
Click OK.

PL/SQL program units organize the code into blocks. A block without a name is an anonymous block. The anonymous block is not stored in the Oracle database. In the debugging process, you use the anonymous block to pass values for parameters.
To debug procedures, packages, and functions, write an anonymous block that calls the necessary routine.
In the Database tool window ( View | Tool Windows | Database) , double-click the PL/SQL object that you created and compiled for debugging.
Click the Run Procedure button
. If the session is not selected, select a session from the list. For more information about managing sessions, refer to Sessions.
From the Execute Routine dialog,
copy and paste the anonymous block to the console
.
Place breakpoints in the anonymous block and in the PL/SQL program object that is referenced in this anonymous block.
(Optional) Modify parameter values.
Click Debug.
A code snippet of the procedure:
CREATE PROCEDURE simpleprocedure (inval NUMBER){...}
A package is a schema object that groups logically related PL/SQL types, items, and subprograms.
Just like with procedures and functions, to debug a package, write the anonymous block that calls the necessary routine.
In the Database tool window ( View | Tool Windows | Database) , double-click the package that you created and compiled for debugging.
Place breakpoints in the package.
Right-click the Oracle data source and select New | Query Console.
Alternatively, select one of the existing consoles from Query Consoles list (CtrlShiftF10).
In the Oracle console, write an anonymous block that triggers the procedure.
Click Debug.
A code snippet of the package:
CREATE PACKAGE PKG_DBGD AS{...}
A code snippet of the anonymous block:
DECLARE{...}
A trigger is a PL/SQL program unit that is automatically called by the DBMS when you issue INSERT, UPDATE or DELETE queries. Triggers are associated with a table and are called before or after you insert, update, or delete a data row. A table can have several triggers.
To debug a trigger, write an INSERT, UPDATE or DELETE query to a table or a view.
Right-click the Oracle data source and select New | Query Console.
Alternatively, select one of the existing consoles from Query Consoles list (CtrlShiftF10).
Type a query in the console.
Place breakpoints in a trigger.
Click Debug.
A code snippet of the trigger:
create table Table_with_Triggers{...}
When you debug PL/SQL code, you can select between two stepping modes: Graceful and Native.
In Graceful mode, you can pause the session that you debug (the target session), set and remove breakpoints. If no valid breakpoints are set, the debugger steps through code on a line-by-line basis.
In Native mode, the debugger uses Oracle native debugging commands. You cannot pause the target session or manage breakpoints but you might experience a boost in performance in CPU-intensive operations (operations that include a lot of computations and loops). You can read more about Oracle debugging commands in the official Oracle documentation. If no valid breakpoints are set, the debugger executes the whole routine.
Open settings (CtrlAlt0S) and navigate to Build, Execution, Deployment | Debugger | Stepping.
From the Stepping mode list, select the stepping mode that you need.
You can force the debugger to pause at the beginning of debuggable code. The place where the debugger pauses is detected automatically. If you assign variable values in the declaration section, the debugger pauses at the variable declaration. If no values are assigned to variables, the debugger skips the declaration section and pauses at the BEGIN keyword in the execution section.
Open settings (CtrlAlt0S) and navigate to Build, Execution, Deployment | Debugger | Stepping.
Select Pause at begin.

Thanks for your feedback!