Running and debugging TypeScript
note
Debugging of TypeScript client-side code is only supported in Google Chrome and in other Chromium-based browsers.
Create as many tsconfig*.json configuration files as you need.
Open the Settings dialog () , go to , and make sure the names of all these files match the patterns from the Typescript config file name pattern list.

In each *tsconfig*.json, specify the files to be processed according to its settings:
List the file names explicitly in the
filesfield:"files" : ["<file1.ts>","<file2.ts>"],Learn more from TSConfig Reference: Files.
In the
includefield, specify the file names or patterns:"include" : ["<pattern1>, <pattern2>"]Learn more from TSConfig Reference: Include.
To skip some files whose names match the patterns listed in the
includefield, list their names or patterns in theexcludefield:"exclude" : ["<pattern3>, <pattern4>"]Learn more from TSConfig Reference: Exclude.
note
RustRover doesn't use just the nearest tsconfig.*.json (from the list of files recognized as
Typescript configfile type). RustRover uses the nearest tsconfig.*.json in which a particular file is somehow specified – either explicitly in thefilesfield or through patterns in theincludeandexcludefields.
Click the Language Services widget on the Status bar.
tip
If no other language services are running against the current file, the title of the widget changes to TypeScriptt.
The TypeScript widget is shown on the Status bar all the time after you have opened a TypeScript file in the editor.
Click
 .
.
In the Compile TypeScript popup, select one of the following options:
To compile the TypeScript code of the entire application, select Compile All.
Alternatively, select Compile TypeScript from the context menu of any open TypeScript file.

tip
You can also press and choose Compile TypeScript from the list.
To compile one file, select the path to it in the Compile TypeScript popup.

To compile files from a custom scope, make sure they are listed in the
filesproperty of your tsconfig.json as described above.In the Compile TypeScript popup, select the path to tsconfig.json.

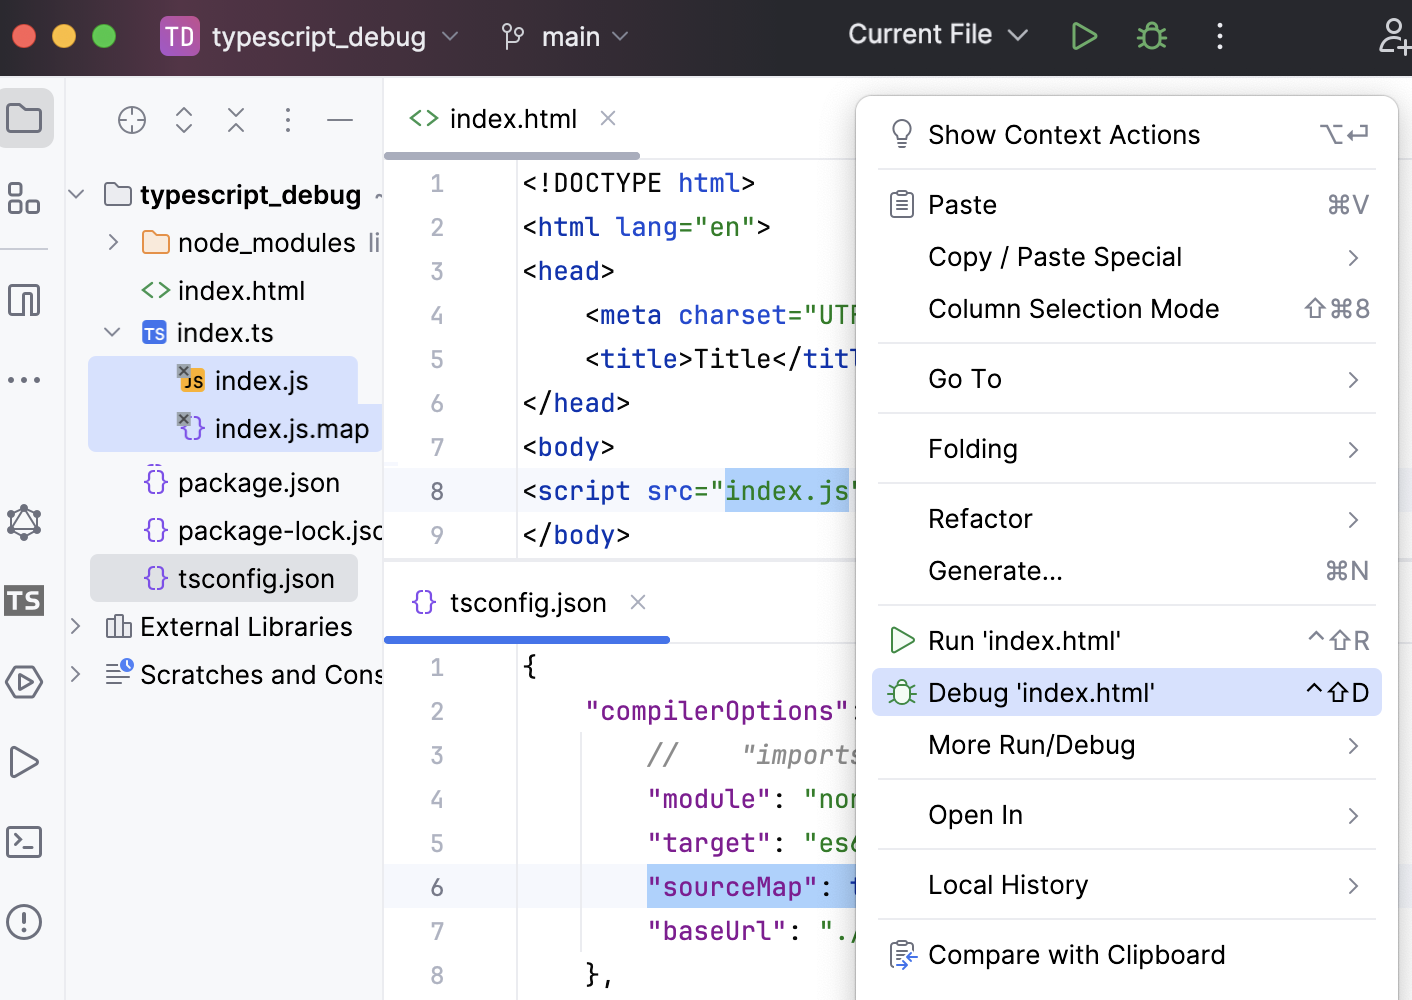
In the editor, open the HTML file with a reference to the generated JavaScript file. This HTML file does not necessarily have to be the one that implements the starting page of the application.
Do one of the following:
Choose from the main menu or press . Then select the desired browser from the list.
Hover over the code to show the browser icons bar:


 . Click the icon that indicates the desired browser.
note
Debugging of TypeScript client-side code is only supported in Google Chrome and in other Chromium-based browsers.
Configure the built-in debugger as described in Configuring JavaScript debugger.
To enable source maps generation, open your tsconfig.json and set the
sourceMapproperty totrue, as described in Create a tsconfig.json file.Configure and set breakpoints in the TypeScript code.
Run the application in the development mode. Often you need to run
npm startfor that.Most often, at this stage TypeScript is compiled into JavaScript and source maps are generated. For more information, refer to Compile TypeScript into JavaScript.
When the development server is ready, copy the URL address at which the application is running in the browser - you will need to specify this URL address in the run/debug configuration.
Go to . Alternatively, select Edit Configurations from the Run widget on the toolbar.

In the Edit Configurations dialog that opens, click the Add button (
 ) on the toolbar and select JavaScript Debug from the list. In the Run/Debug Configuration: JavaScript Debug dialog that opens, specify the URL address at which the application is running. This URL can be copied from the address bar of your browser as described in Step 3 above.
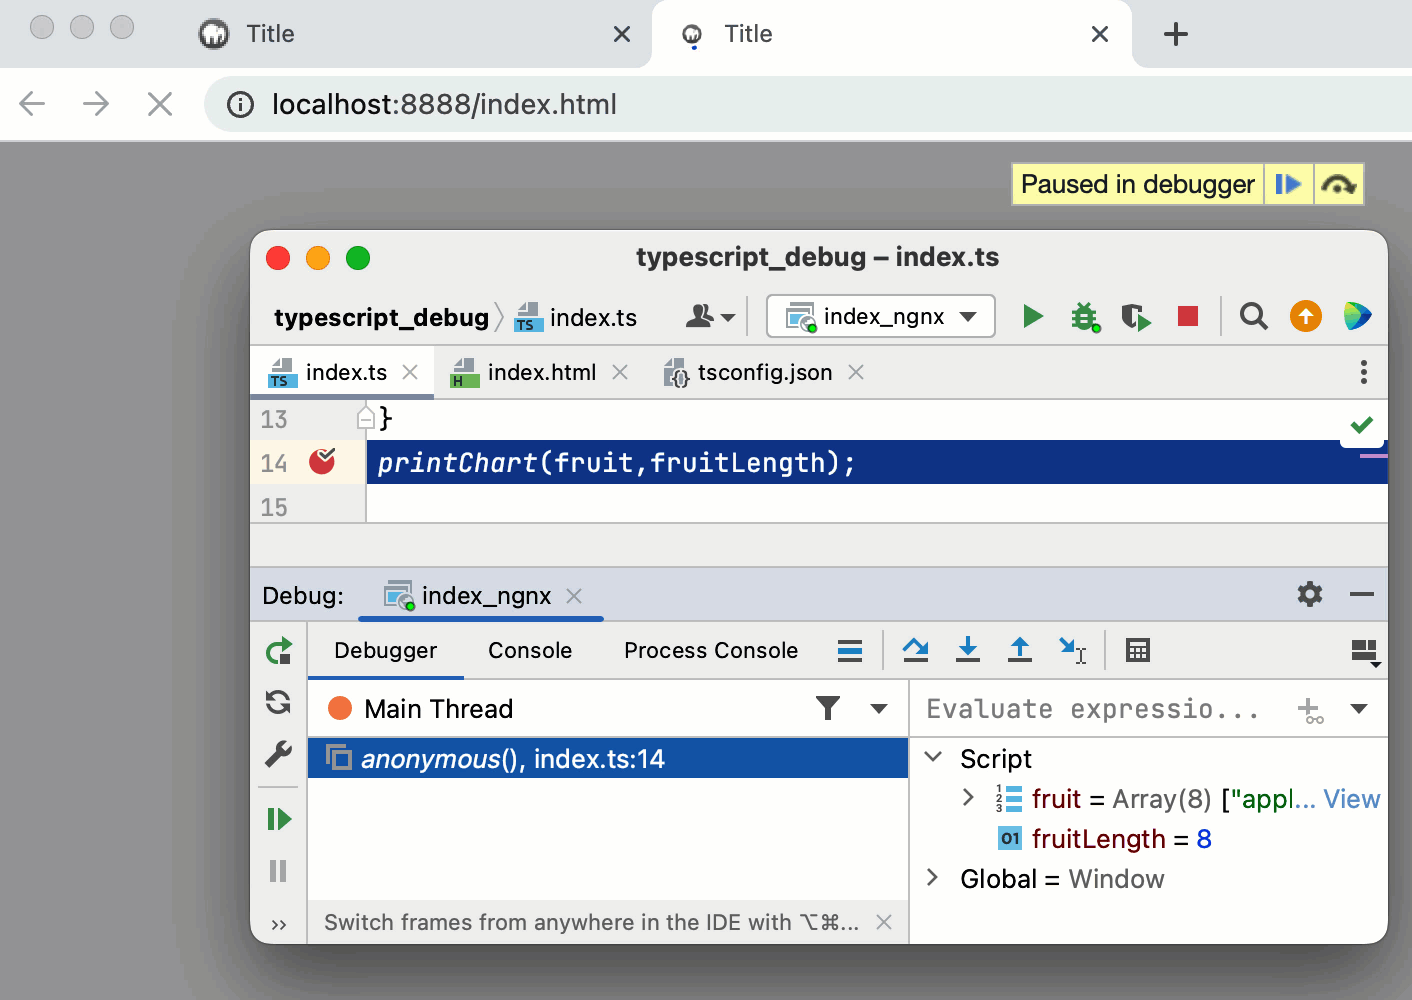
From the Run widget list on the toolbar, select the newly created configuration and click
 next to it. The URL address specified in the run configuration opens in the browser and the Debug tool window appears.
You may need to refresh the page in the browser to get the controls in the Debug tool window available.
In the Debug tool window, proceed as usual: step through the program, stop and resume program execution, examine it when suspended, explore the call stack and variables, set watches, evaluate variables, view actual HTML DOM, and so on.