Matrix Report for Issues
Matrix report lets you summarize and compare your project issues by their most important attributes, view the summary as a table or a chart, and export it in a .csv or .xlsx format.
To view Matrix report:
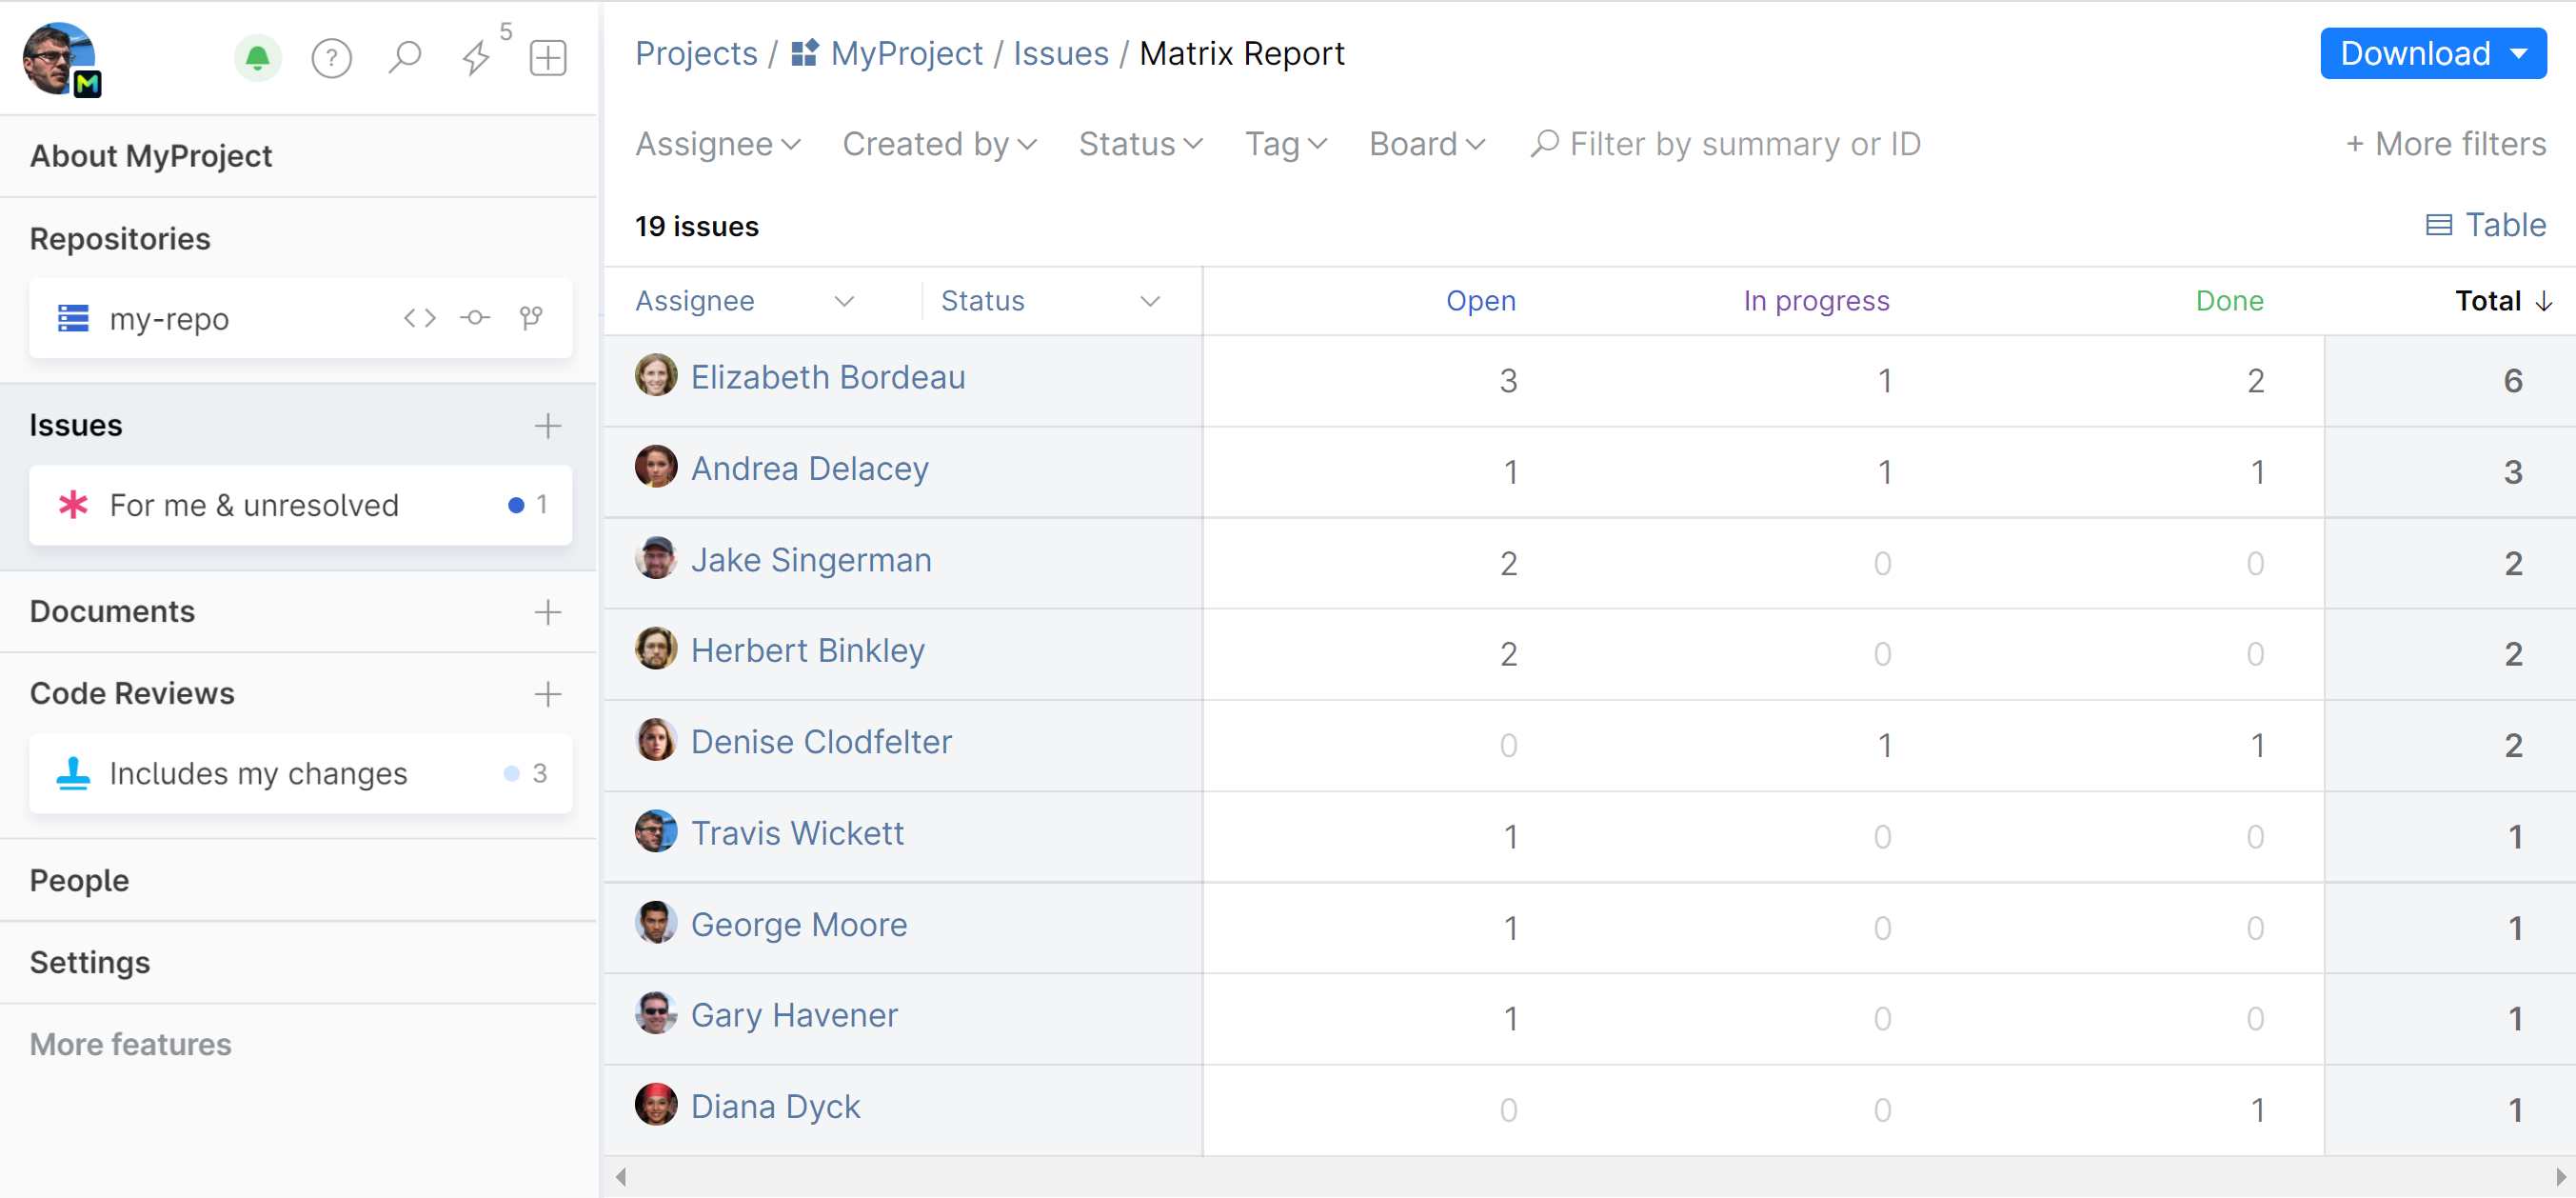
The default view lets you see how many issues in different statuses and in total each assignee currently has:

You can drill down each table cell for more info — just click on a number to get a list of respective issues.
Customize Matrix report
You can compare issues by two attributes at a time, one for the column and one for the row, choosing from: Assignee, Created by, Status, and Tag:


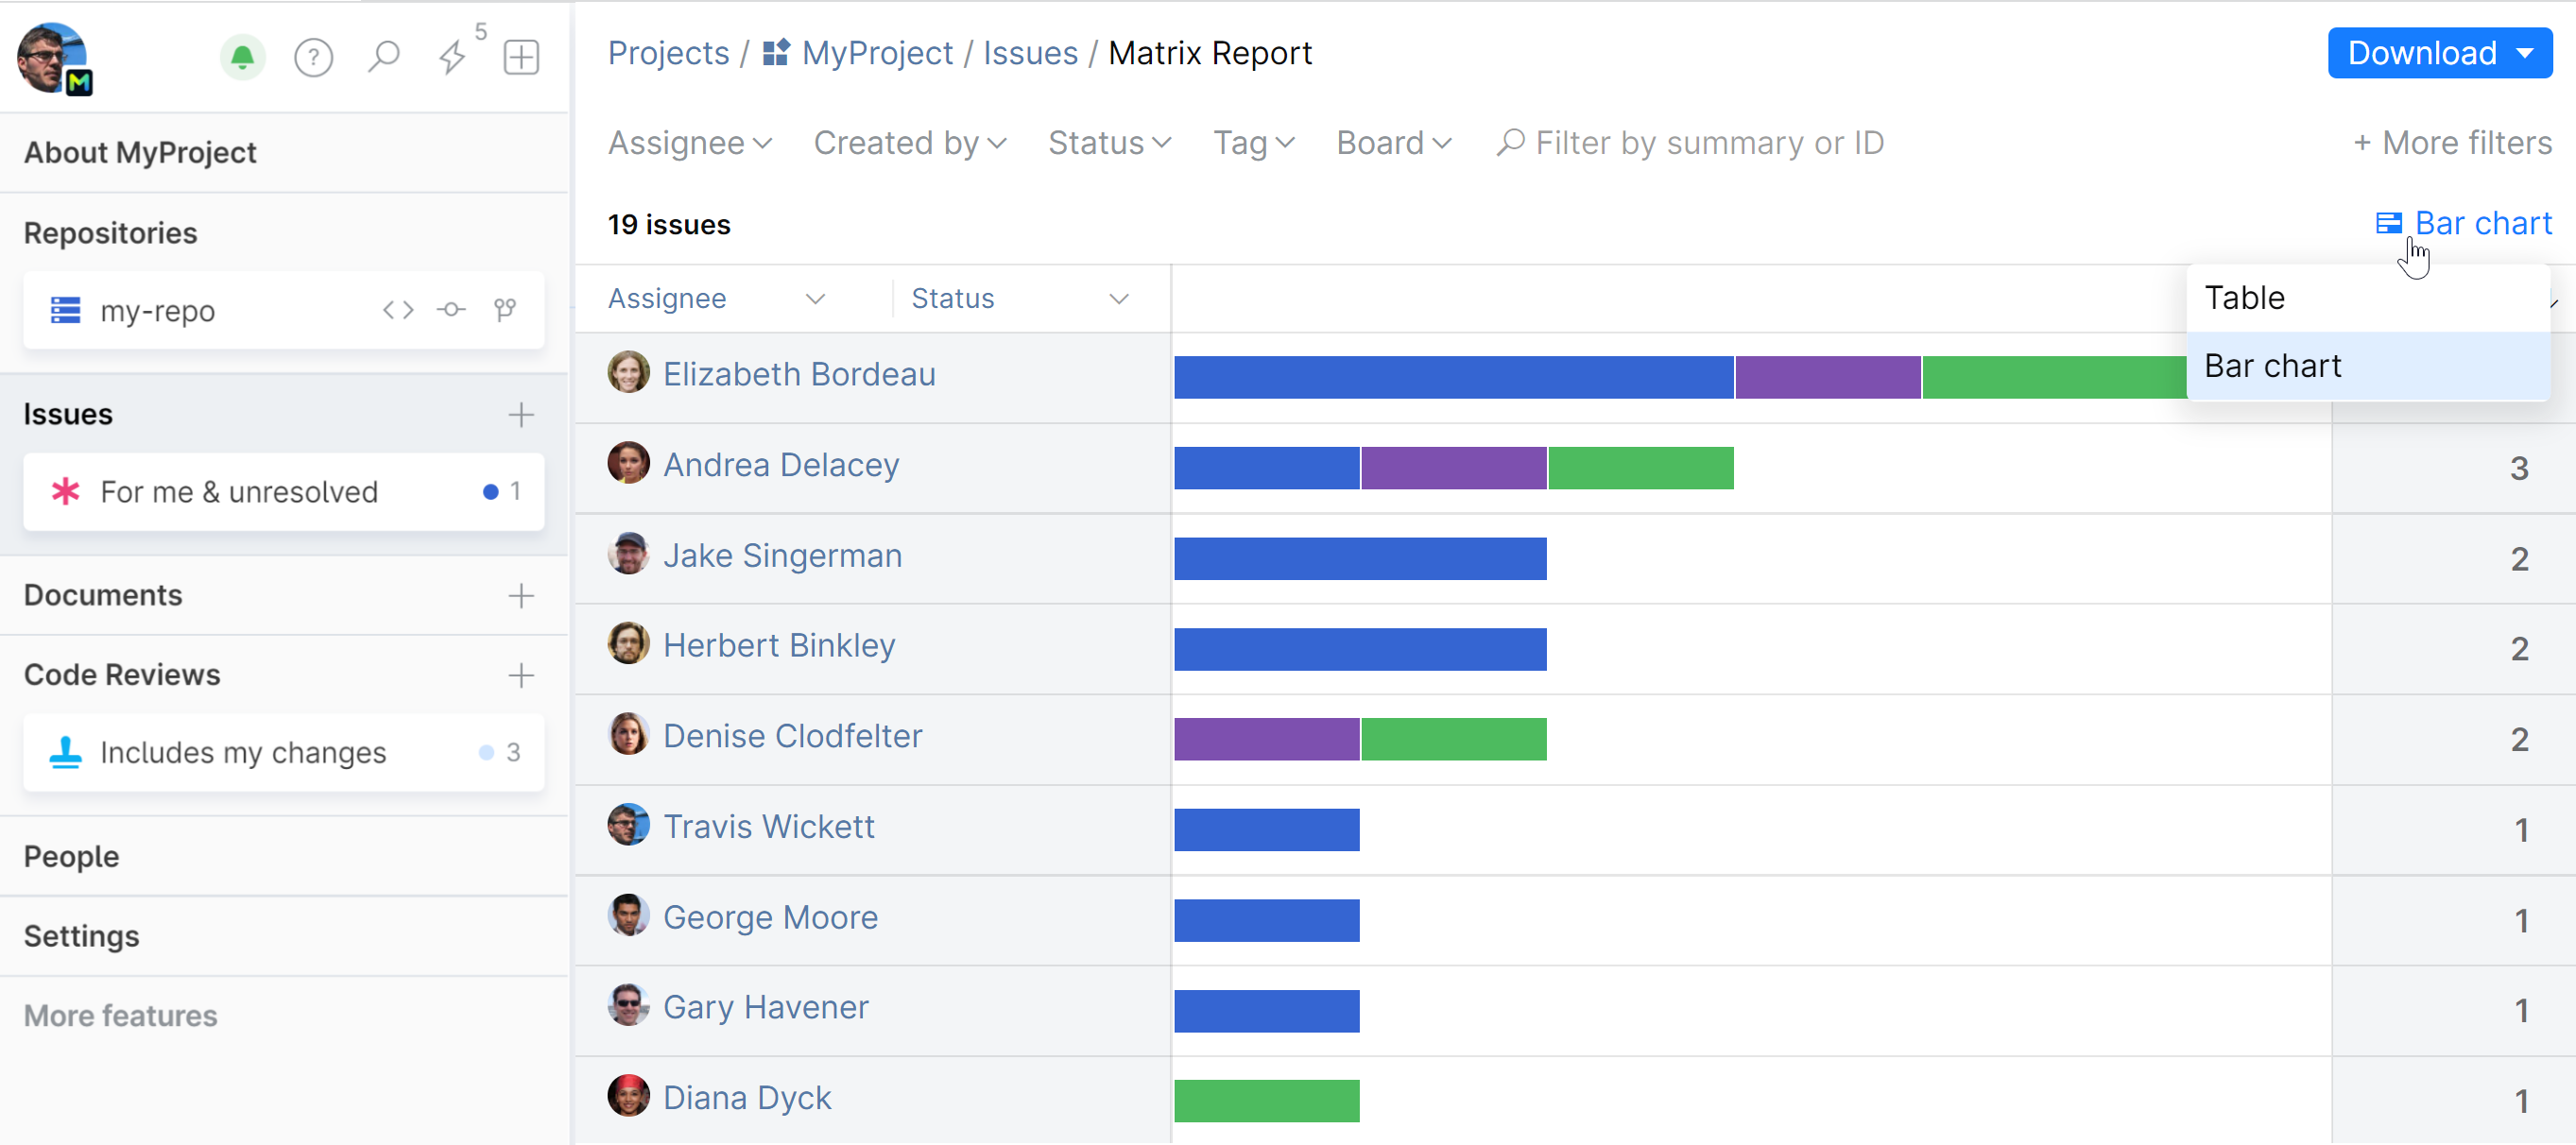
Toggle the view between Table and Bar chart:

Export Matrix report
To download and export your Matrix report as a .csv or .xlsx file, click Download in the top right corner and choose the desired format:

Last modified: 11 May 2022
