dotCover
The dotCover runner uses the JetBrains dotCover to produce coverage reports for .NET processes. Generated reports are published to the Code Coverage tab of the Build Results page.
This runner can also be placed after multiple preceding .NET steps to merge their individual code coverages and publish a consolidated report.
dotCover Step Settings
This section explains how to use runner settings. Refer to the sections below for the examples on how to combine these settings depending on your current task.

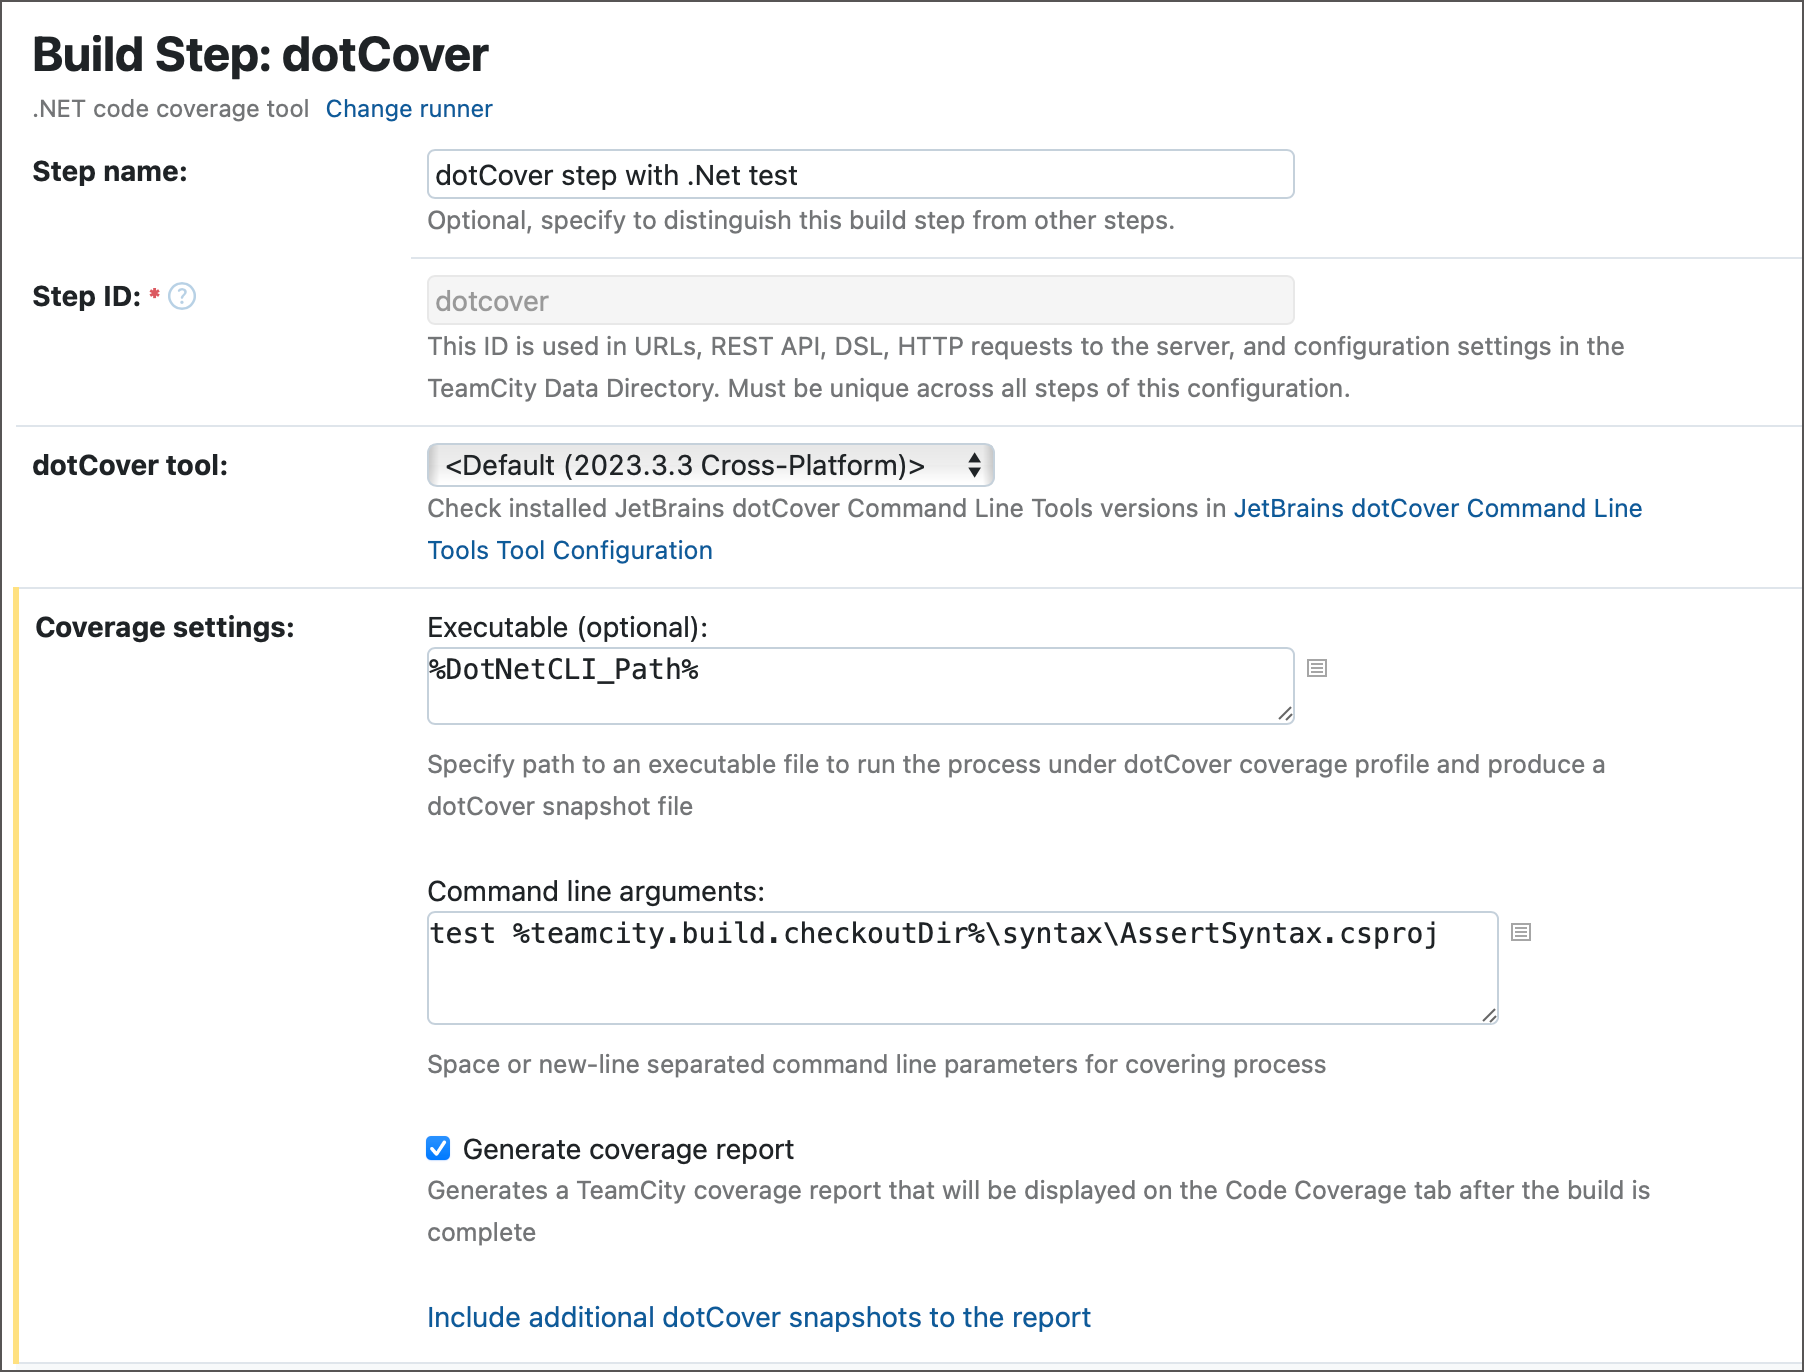
dotCover tool — select a pre-installed or a custom version of dotCover.
Executable and Command line arguments — optional settings that allow you to run a custom process with required arguments under dotCover coverage profile. The Executable field accepts paths to an object that spawns process to profile (for example, to a .NET CLI or to an .exe/.dll of the dotCover tool itself). Leave these settings empty if you use this step to merge snapshots generated by preceding dotCover, .NET, or NUnit runners.
Generate coverage report — specifies whether Build Result pages should display data from generated code coverage reports on its Code Coverage tabs.

Leave this setting unchecked if you do not need a report published on the Build Results page. For example, if you intend to publish produced .html and .dcvr files as build artifacts and use them elsewhere.
Include additional dotCover snapshots to the report — paths to .dcvr snapshots that the runner should use to generate a final coverage report.
Note that since dotCover automatically gathers snapshots from preceding dotCover and .NET steps, you do not need to define these rules as long as all required snapshots are produced in the same configuration. This setting allows you to include snapshots from stand-alone configurations imported via artifact dependencies.
Advanced Settings
Assembly filters — type "+:assemblyName" to include or "-:assemblyName" to exclude assemblies to/from the code coverage.
Attribute filters — type "-:attributeName" to exclude any code marked with this attribute from the code coverage.
Additional arguments — the list of additional command-line arguments for the
dotCover covercommand.
Examples: Generating a Consolidated Report
The dotCover runner can be used as a one-stop shop that tests the required project and generates a code coverage report. The following Kotlin DSL sample illustrates this setup.
However, in this simple scenario the final result is similar to running a .NET step with dotNet coverage enabled in its settings. The true strength of the dotCover runner lies in its ability to collect snapshots from different sources and produce a combined code coverage report. The samples below illustrate how to set up the dotCover runner depending on the exact sources of these snapshots.
From a Single Build Configuration
The sample configuration below includes multiple .NET steps that test different projects. Each of these steps has "JetBrains dotCover" selected under Code Coverage. The final dotCover step does not produce its own snapshots. Instead, it gathers all .NET runners' snapshots to create a final consolidated report published to the Code Coverage tab.
This setup requires only the Generate coverate report option selected, other runner settings remain empty.
From a Build Chain
The build chain below inludes two configurations.
Configuration A runs .NET steps to test individual projects with code coverage. Produced .dcvr snapshots are published as artifacts.
The final dotCover step of Configuration B creates a joint report by combining the following snapshots:
snapshot generated by the .NET step of Configuration B (testing "Project C")
dotCover's own snapshot from testing "Project D"
snapshots generated by Configuration A and imported to Configuration B via artifact dependencies
From Parallel Tests
Your .NET runners can employ the Parallel Tests build feature to break down huge tests suites into individual batches that are executed on different agents. If you add a dotCover step to a configuration with parallel tests, it will not merge snapshots generated by individual builds that run separate batches. Each individual build will show its own results on the Overview tab of the Build Results page, and the Code Coverage tab with the consolidated report will be absent.

If you want a consolidated report, you can employ a solution similar to the one shown in the From a Build Chain section: create a dependent build configuration that will gather snapshots from all batches and merge them into a single report.
The difference in this use case is that you should rename snapshots before publishing them as artifacts. Otherwise, since each parallel build has identical settings, snapshots have identical names and each build that finishes after a faster parallel build will override its artifacts. Refer to the following section to learn more: Publish Artifacts Produced By Batch Builds