Remote Debug
Remote Debug is a feature allowing you to remotely debug your tests on the TeamCity agent machine from the IDE on the local developer machine. This feature is of use when the agent environment is unique in some aspect, which causes a test to fail, and it is difficult to reproduce the problem locally.
With TeamCity integration for IntelliJ-based IDEs enabled, remote debug sessions can be launched right from IntelliJ IDEA for the builds based on the IntelliJ IDEA Project and Ant build steps.
Currently, the following IntelliJ IDEA run configurations are supported:
Java application run configuration
JUnit run configuration
TestNG run configuration
Remote debug for Ant steps requires that the build configuration have the teamcity.remote-debug.ant.supported=true parameter.
Prerequisites
IntelliJ IDEA run configuration on the local developer machine with the TeamCity plugin for IntelliJ IDEA installed
Build configuration on the TeamCity Server with the IntelliJ IDEA Project runner as one of the build steps
Remote TeamCity agent to run this build available to the local machine by socket connection
Debugging Tests Remotely
To start remote debugging of a test, select the test and choose the Debug <Test Name> Remotely on TeamCity Agent option from the context menu (the Remote Debug action is also available from the TeamCity plugin menu. The action will require you to select an IntelliJ IDEA run configuration).
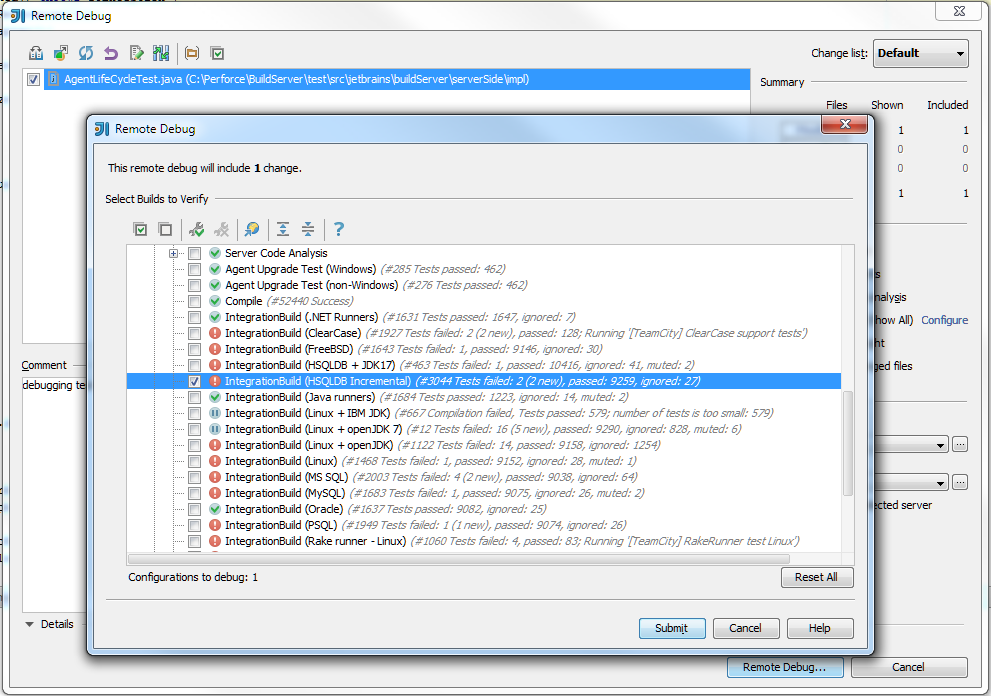
Once you do this, the TeamCity plugin will ask you to select a build configuration where you want to start the debug session. The process is similar to starting a personal build. For example, if there are personal changes, a personal patch will be created and sent to an agent. Also, since the process is basically the same, when you select a build configuration, you can specify an agent, customize properties, and so on.

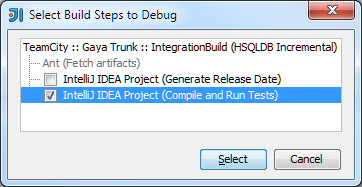
If the selected configuration contains more than one IntelliJ IDEA Project build step, the plugin will ask you to choose build steps where to start the debug session.

After that, a build is added to the queue and the standard IntelliJ IDEA debug tool window appears:

The debug tool window works in the listening mode, i.e. it waits for the agent to connect to it. Once the agent connects, the Java process on the agent is paused and the Agent Attached notification appears in the IDE:

Now we can set some breakpoints and actually start the debug session by clicking Start either in the notification popup or in the debug tool window.
Once JVM process exits, another notification popup appears in the IDE:
The debug session is not finished yet, it is possible to either repeat or finish it. Selecting Repeat will rerun the same build step again, which is much faster than starting a new debug session.