Build Results Page
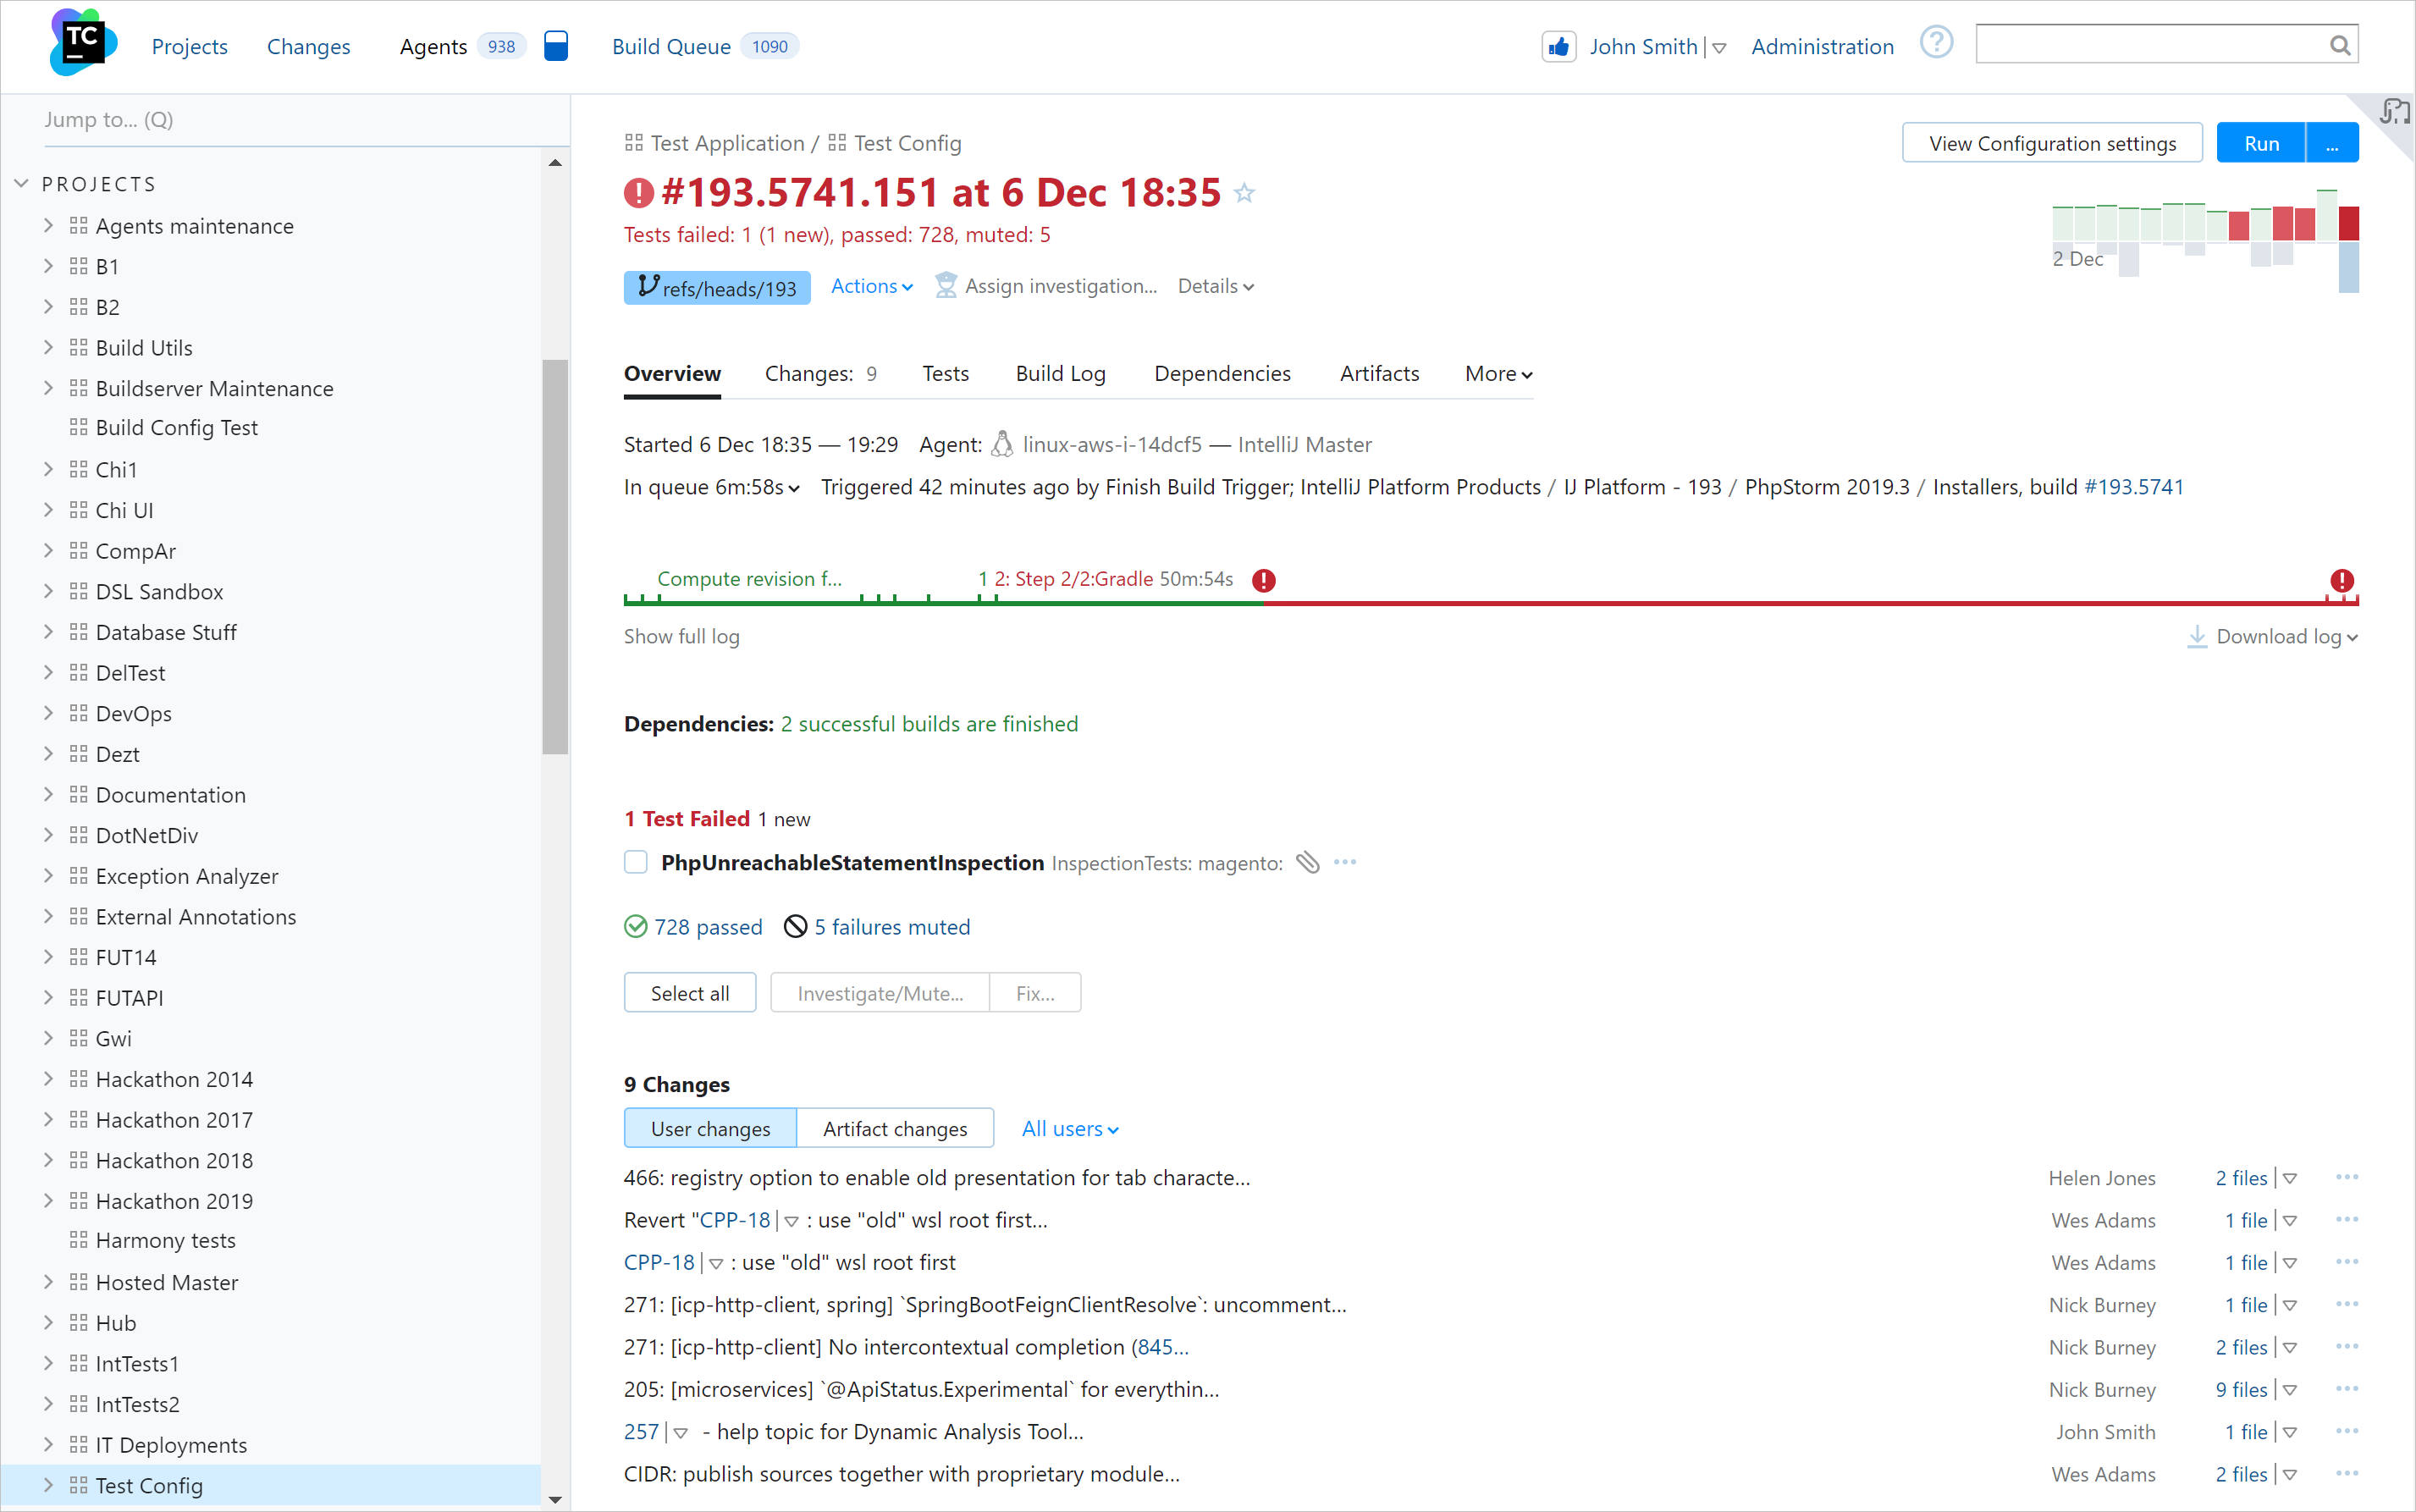
In TeamCity, all information about a build, whether it is queued, running or finished, is accumulated on its Build Results page. This page can be accessed from the Build Configuration Home page and from various places in the TeamCity UI where a build number or build status appears as a link, when browsing in the Home mode. Some data is accessible only after the build is finished, some details like Changes, Parameters, and Dependencies are also applicable to the build while it is waiting in the queue.
This article gives an overview of the Build Results page of the new TeamCity UI. Most of its features are also available in the classic UI mode.
Internal Build ID
In the URL of the Build Results page, you can find the parameter buildId with a numeric value. This number is the internal build ID uniquely identifying the build in the TeamCity installation. You might need this ID when composing a URL manually. For example, for REST API requests or when downloading build artifacts.
Build Results Title Panel
The Build Results page contains several tabs, whose set depends on the current build's specifics, and a few common elements:
Branch selector which displays the branch of the current build. When in Build Configuration Home, this selector allows actually filtering the list of displayed builds by a specfic branch.
The Actions menu (described here).
The Details block: when expanded, shows the main info about the current block.
The Investigation widget which lets you quickly assign an investigation of this build or see the details of the open investigation.
The Trends widget which shows all the previous builds and their details. Hover a build to see its details.
Overview Tab
The Overview tab displays general information about the build, such as the build duration, the agent used, trigger, and dependencies. The set of tabs depends on the steps and specifics of the current build. If a build is queued, the tab displays the position of the build in the queue, the time the build is supposed to start, and so on.

It also shows the diagnostic messages related to the current build's status.
Changes Tab
The Changes tab displays information about changes in the build and provides advanced filtering capabilities for the list of changes. You can filter changes by their author, comment, path, and revision.
To view changes from dependencies, check the corresponding box.
You can view modified files by checking the Show files box. Clicking a filename opens the diff viewer.
Enabling Show graph displays the changes as a graph of commits to the VCS roots related to this build. The graph appears on the left of the list and presents the changes with a variable level of detailing, allowing you to:
Navigate to a graph node to display the VCS root revision number.
View the VCS roots which were changed in this build: on hovering over the area on the left of the changes list, each of the roots is highlighted as a bar.
Click a bar to select a single VCS root. Only the changes pertaining to this root are visible, others are grayed out.
If there have been merges between the branches of the repository, the graph displays them.
If your VCS root has subrepositories (marked S in the list of changes), navigate to a node in the parent to see which commits in subrepositories are referenced by this revision in the parent.
From the Changes tab, you can:
Review all changes included in the build with their corresponding revisions in version control.
Review changes included in the build that the current build depends on: if the current build configuration has an artifact dependency, and the artifact downloaded in the current build has changed compared to the one downloaded in the previous build of the current configuration, the Artifact dependencies changes node appears displaying the build which was used to download artifact dependencies from, and the changes which were included in that build.
Configure the VCS settings of the build configuration (if you have enough permissions).
For each change on this page, you can:
Explore the change in details.
View which dependent build the changes come from or builds with snapshot dependencies with the "Show changes from snapshot dependencies" option enabled.
Navigate to the Change Details by clicking a changed file link.
Trigger a custom build with this change.
Download the patch.
Download the patch to your IDE.
Build Log Tab
The graphic build log timeline reflects the duration of each build stage and indicates build problems:

Click any stage to open the corresponding line of the build log.
More information on build logs in TeamCity is available here.
Artifacts Tab
If the build produced artifacts, they all are displayed on the dedicated Artifacts tab.
Parameters Tab
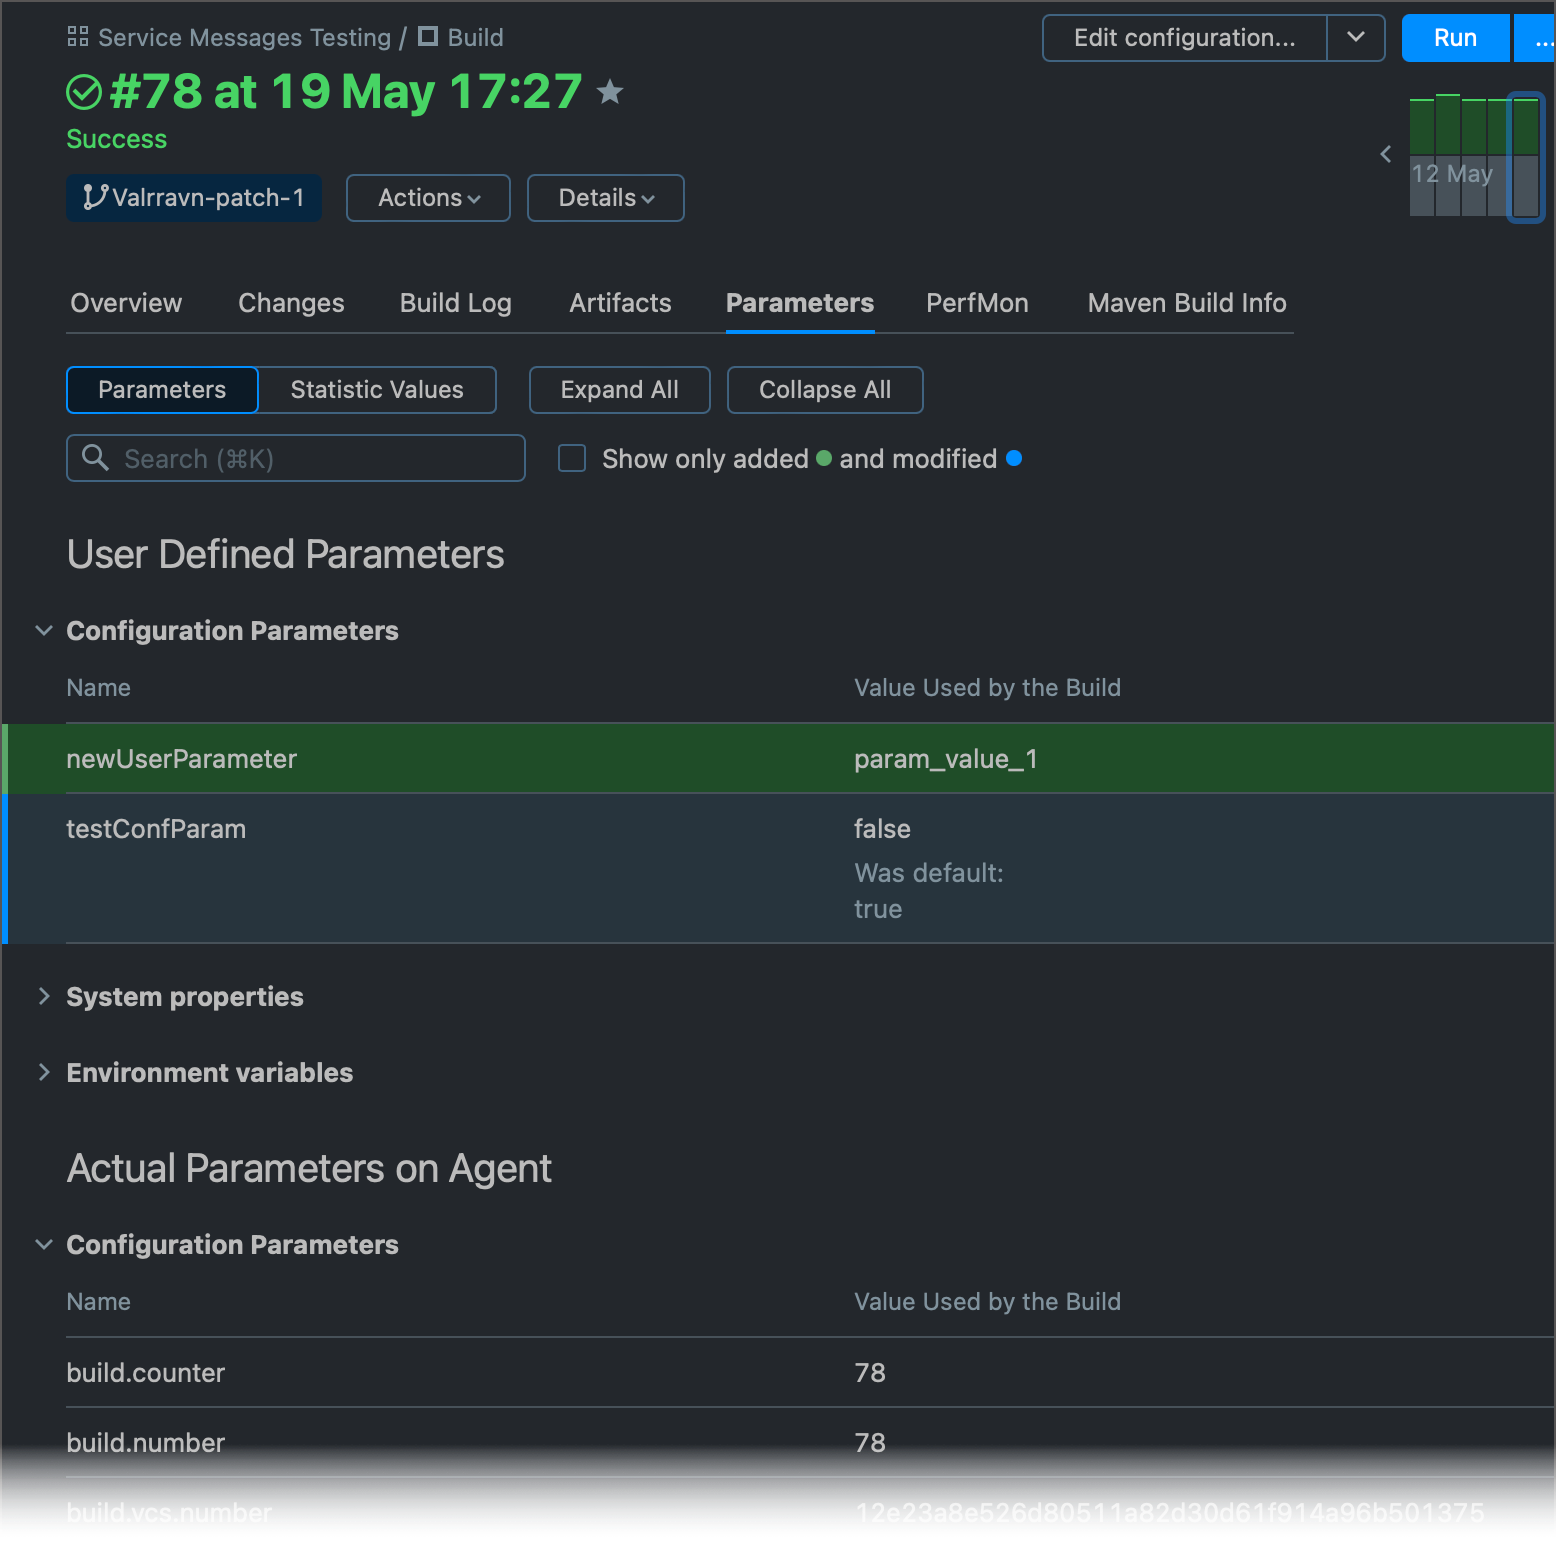
The Parameters tab shows all actual (at the time of this build) values of build parameters.

This page has two tabs:
Parameters — lists values for all configuration parameters, system properties, and environment variables. Highlights parameters that were added/modified in custom builds.
Statistic values — lists all statistics values reported for the build (for example, build success rate or time required to check out a remote repository). The View Chart button (
 ) allows you to check how these values trend throughout build runs.
Dependencies Tab
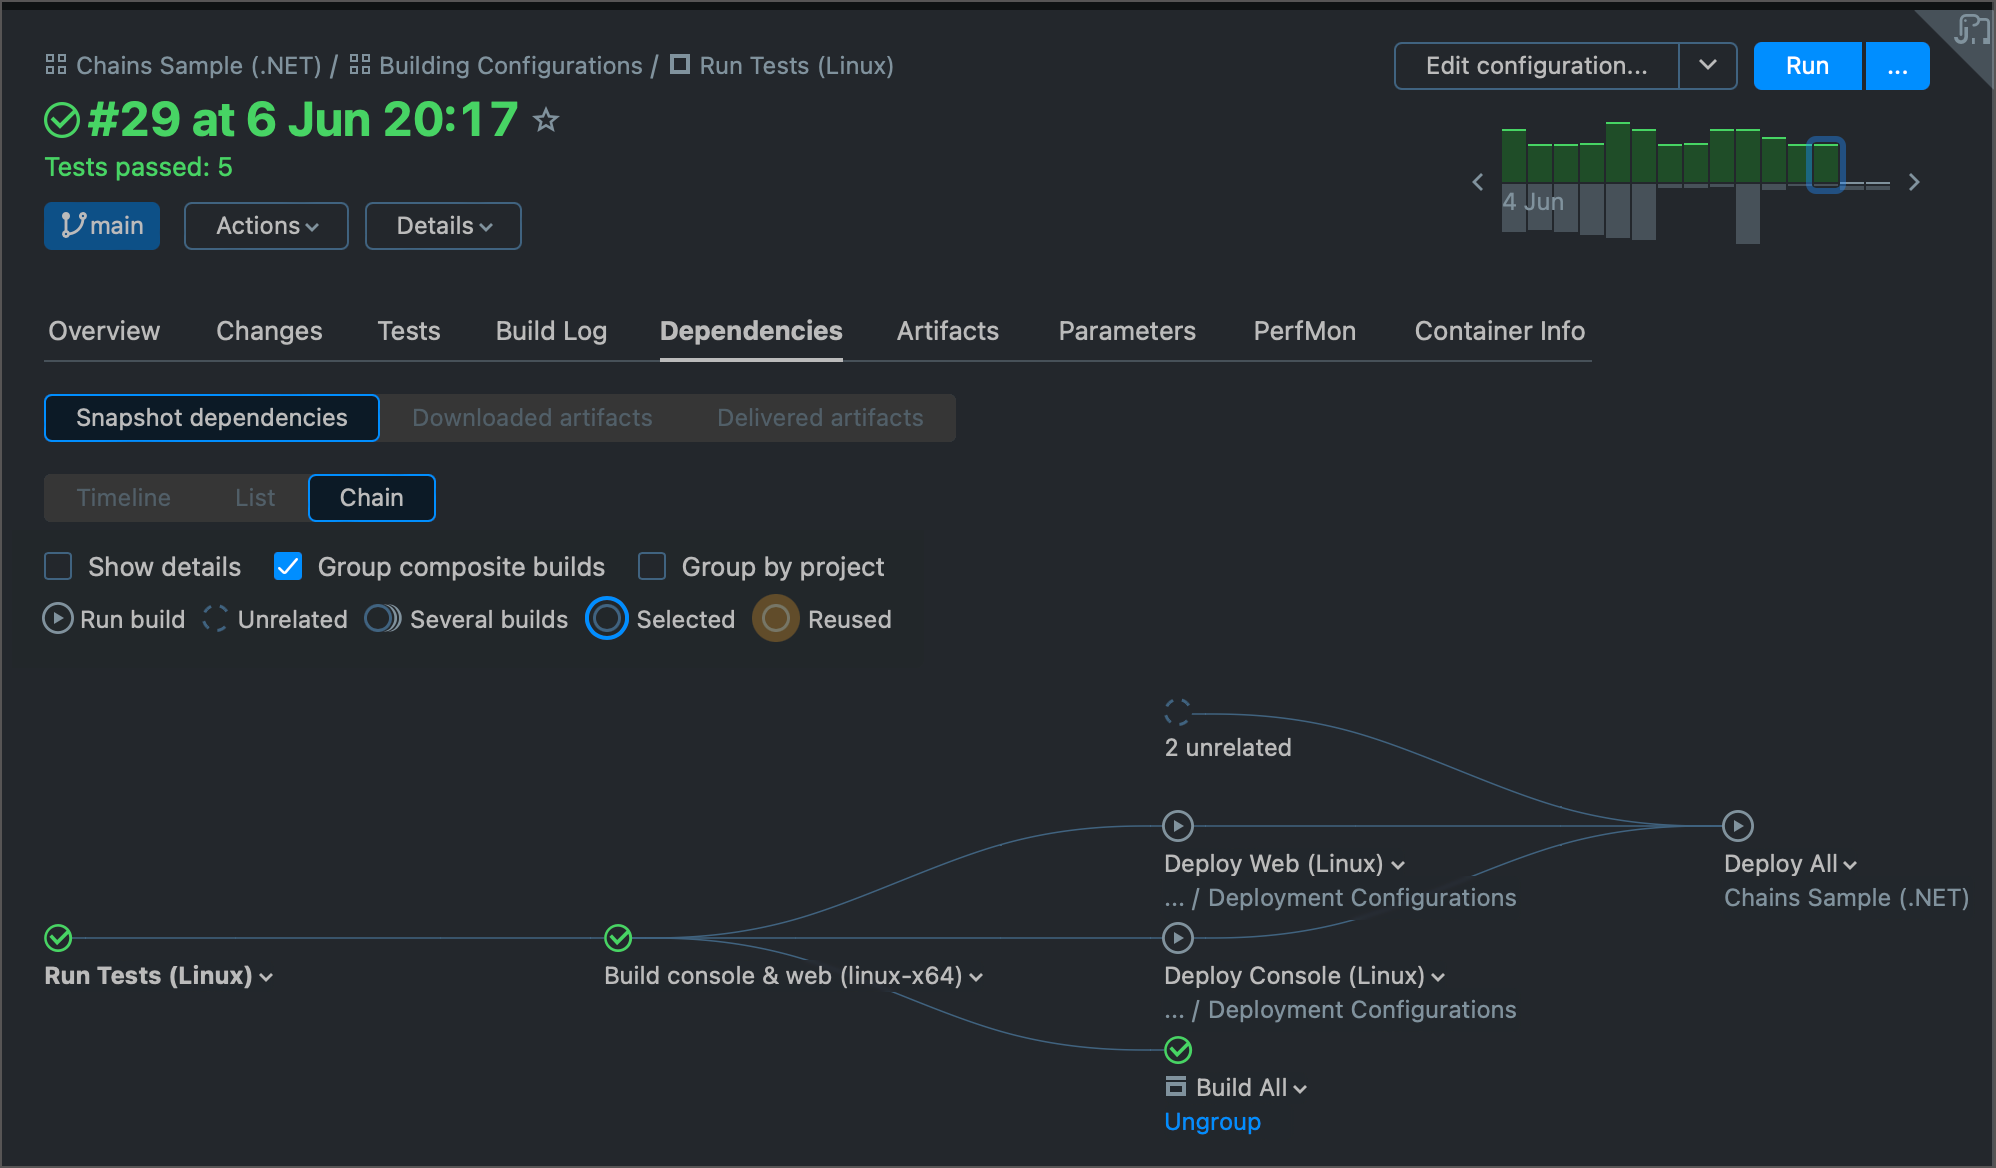
If a finished build has artifact and/or snapshot dependencies, the Dependencies tab is displayed on the Build Results page. Here you can explore builds whose artifacts and/or sources were used for creating this build (downloaded artifacts) as well as the builds which used the artifacts and/or sources of the current build (delivered artifacts). Additionally, you can view indirect dependencies for the build. That is, for example, if build A depends on build B which depends on builds C and D, then these builds C and D are indirect dependencies for build A.
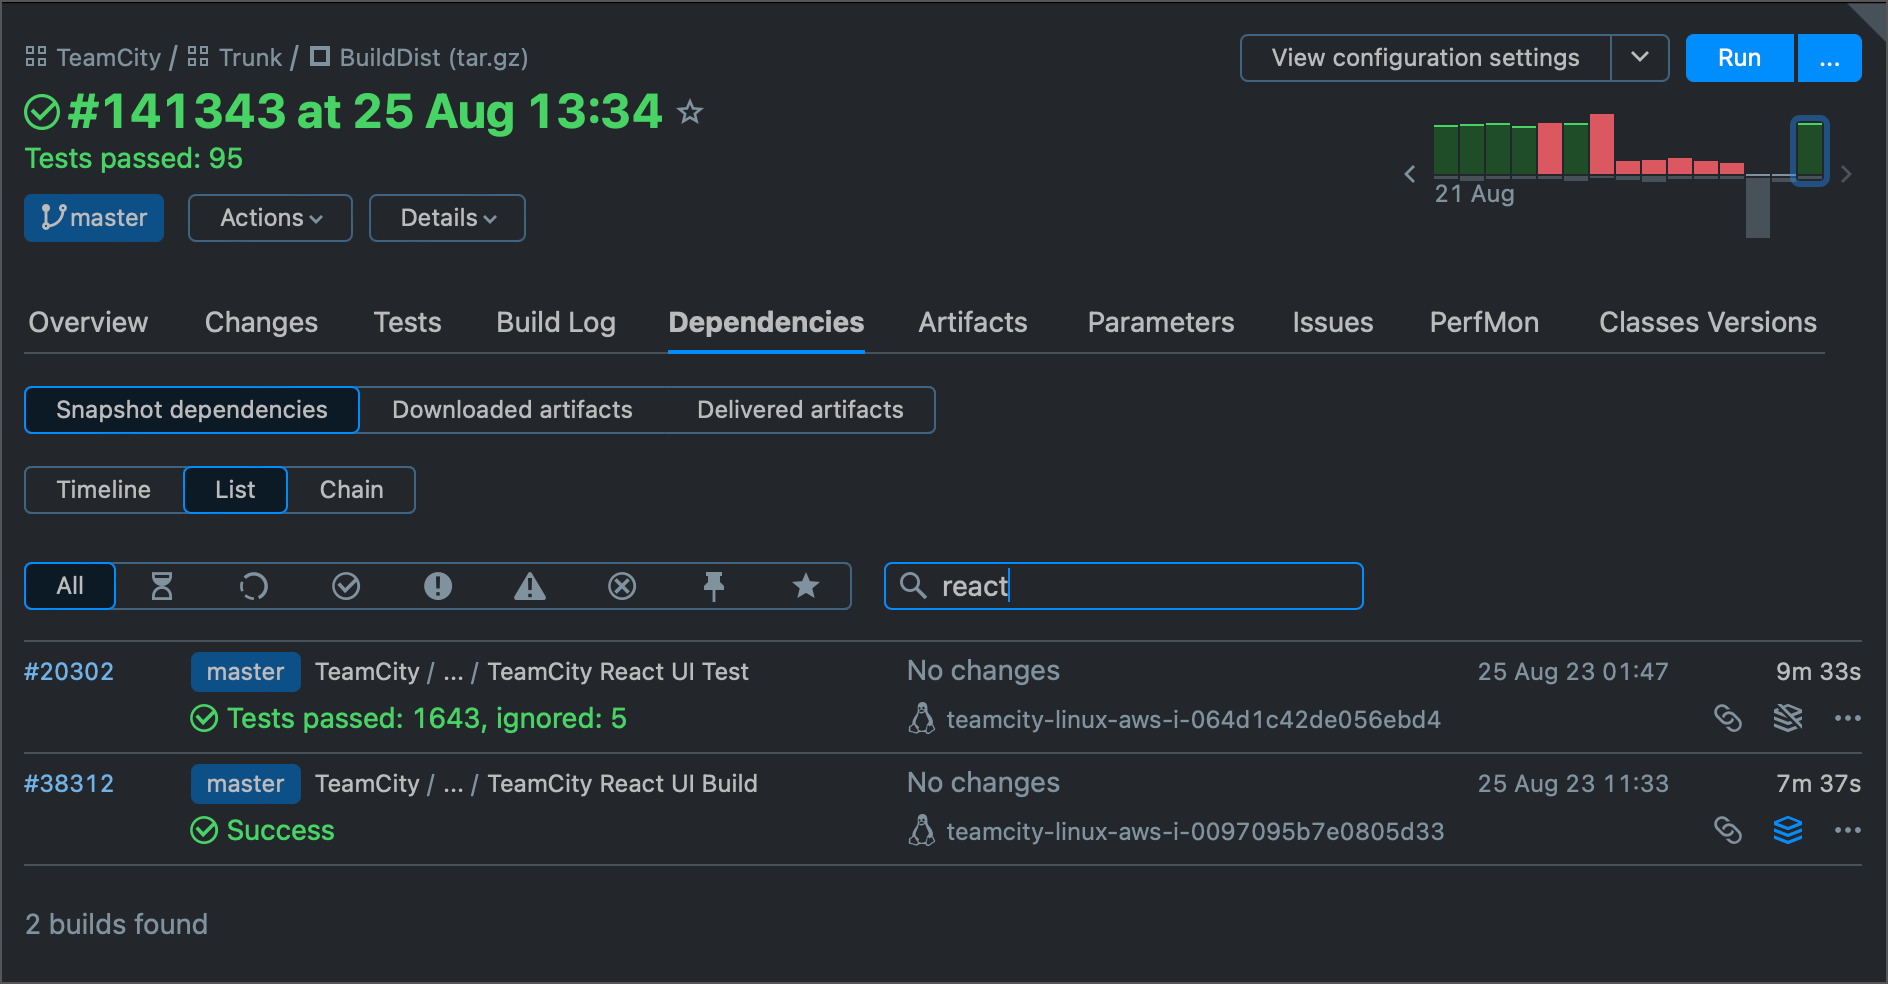
The Dependencies tab provides three modes of displaying the build dependencies: a visual timeline, structured list, and build chain. Choose the mode that is the most helpful for your current task.

The "Timeline" and "List" view modes allow you to search for specific builds by their names.

Issues Tab
If you have integration with an issue tracker configured and if there is at least one issue mentioned in the comments for the included changes or in the comments for the build itself, you will see the list of issues related to the current build in the Issues tab.
Code Coverage Tab
If you have code coverage configured in your build runner, the Code Coverage tab with the full HTML code coverage report will appear.
By clicking the links in the Coverage Breakdown section, you can drill down to display statistics for different scopes: for example, Namespace, Assembly, Method, and Source Code.
Code Inspection Tab
If configured, the results of a Code Inspection build step are shown on the Code Inspection tab. Use the left pane to navigate through the inspection results; the filtered inspections are shown in the right pane.
Switch from the Total to Errors option, if you are not interested in warnings.
Use the scope filter to limit the view to the specific directories. This makes it easier for developers to manage specific code of interest.
Use the inspections tree view under the scope filter to display results by specific inspection.
Note that TeamCity displays the source code line number that contains the problem. Click it to jump the code in your IDE.
Duplicates
If your build configuration has Duplicates build runner as one of the build steps, you will see the Duplicates tab in the Build Results.
The tab consists of:
A list of duplicates found. The new only option enables you to show only the duplicates that appeared in the latest build.
A list of files containing these duplicates. Use the left and right arrow buttons to show selected duplicate in the respective pane in the lower part of the tab.
Two panes with the source code of the file fragments that contain duplicates.
Scope filter in the upper-left corner lists the specific directories that contain the duplicates. This filtering makes it easier for developers to manage the code of interest.
Tests Tab
The Tests tab allows switching between failed, ignored, and succeeded tests, and use various filters.
For each failed test, you can view its stacktrace, the diff between the expected and actual values, jump to the test history, assign a team member to investigate its failure, open the test in your IDE and/or start fixing it right away.
To see a detailed test or investigation history, click Show test history or Show investigation history in its context menu.
Clicking the Show test history link opens the Test details page where you can find following information:
The test details, including the test success rate and test's run duration data and graph.
A complete test history table containing information about the test's status, its duration, and information on the builds this test was run in.
Test Duration Graph
The Test Duration graph is useful for comparing the amount of time it takes individual tests to run on the builds of this build configuration.
Test duration results are only available for the builds which are currently in the build history. Once a build has been cleaned up, this data is no longer available.
You can perform the following actions on the Test Duration Graph:
Filter out the builds that failed the test by clearing the Show failed option.
Calculate the daily average values by selecting the Average option.
Click a dot plotted on the graph to jump to the page with the results of the corresponding build.
View a build summary in the tooltip of a dot on the graph and navigate to the corresponding Build Results page.
Filter information by agents selecting or clearing a particular agent or by clicking All or None links to select or clear all agents.
Maven Build Info Tab
For each Maven build, a build agent gathers Maven-specific build details to be displayed on the Maven Build Info tab after the build finish. This tab can be useful for build engineers when adjusting build configurations.
Classic UI Tabs
Other classic UI tabs, not yet reproduced in the new UI, are also available: click More and select the required tab in the list. To view the sections described below, yu can also temporarily switch to the classic UI via the respective toggle in the upper right corner.
Build History in Classic UI
Build history is a record of the past builds produced by TeamCity. It is displayed as the Trends widget in the new UI and as the menu with links in the classic UI, which is described below.
To view the history of builds in the current configuration, click previous and next links in the upper right corner of Build Results. Click All history link to open the History tab.
Navigation menu:
![]()
The History tab:

Tests History in Classic UI
The Tests tab of the classic UI differs from the new version and contains a few unique features, such as the ability to download all tests in CSV and pop-up duration graph images. You can temporarily switch to it whenever you need its capabilities.